Africa’s Solar Revolution Is Finally Here,solar imports have risen by 60 percent in 2025

For years, experts have predicted that Africa would become the next big frontier for solar energy. That moment may finally be here.

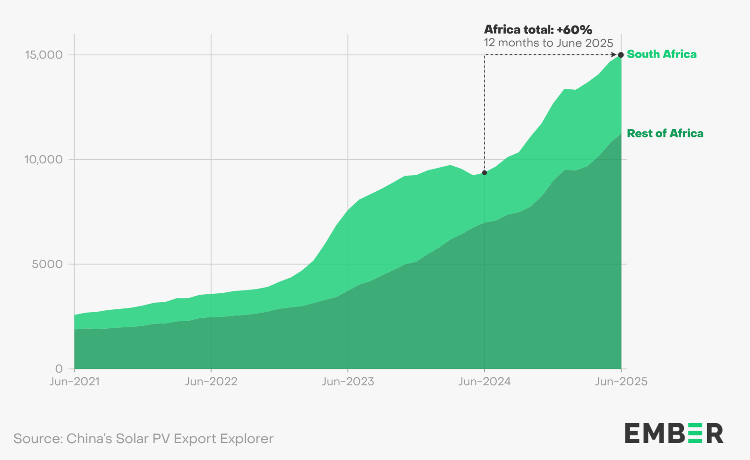
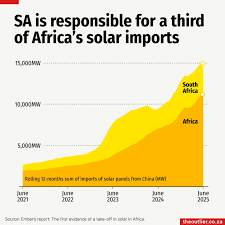
According to new data analyzed by Ember, the continent has seen a massive 60% increase in solar panel imports from China over the past 12 months—rising to 15,032 MW of new capacity by mid-2025. This unprecedented growth represents the first clear evidence of a continent-wide solar take-off that could reshape Africa’s energy landscape.

Solar is no stranger to Africa. For decades, small-scale systems have powered rural schools, hospitals, streetlights, boreholes, and mini-grids. But until recently, large-scale deployment was concentrated in South Africa and Egypt, the only countries with gigawatt-level capacity. Now, the data shows that’s rapidly changing.

south africa is responsible for a third of Africa,s solar imports📈 Solar Imports Across Africa Are Skyrocketing

Between mid-2024 and mid-2025, 20 African countries set new solar import records, and 25 imported at least 100 MW—up from just 15 countries the year before.

The biggest importers were South Africa, Nigeria, and Algeria, with strong growth also seen in Zambia, Botswana, Sudan, Liberia, Benin, Angola, and Ethiopia. Algeria’s imports alone increased 33-fold in a single year.

Even more significant: imports outside South Africa nearly tripled in two years, from 3,734 MW in 2023 to 11,248 MW in 2025.

This means that for the first time, solar energy growth in Africa is becoming broad-based and pan-continental, not just concentrated in a few leading economies.

☀️ What This Means for Electricity Generation

If installed, the panels imported in just the past year could transform national energy balances.

  • In Sierra Leone, imported solar capacity could generate electricity equal to 61% of total 2023 generation.
  • In Chad, it could cover 49%.
  • In Liberia, Somalia, Eritrea, Togo, and Benin, solar could add between 10–25% to existing power output.

Altogether, 16 African nations could see an increase of at least 5% in total generation—an extraordinary leap for a single year’s imports.

Although Africa as a whole remains at just 2% growth (due to the large size of South Africa and Egypt’s grids), the momentum is clearly building.

⛽ From Diesel Dependency to Solar Independence

One of the most powerful impacts of this solar surge is the reduction in fuel imports.

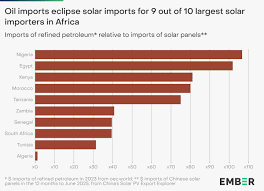
In nine of Africa’s ten biggest solar importers, the value of refined petroleum imports still outweighs solar panel imports by 30 to 107 times. Yet this imbalance may soon start to change.Solar systems pay for themselves quickly in Africa’s high-fuel-cost economies. For example:

  • In Nigeria, a 420-watt solar panel costs about $60 and can generate 550 kWh per year.
  • Producing the same amount of power with diesel would cost roughly $120, given current fuel prices.

That means the payback period for solar in Nigeria is less than six months—and even shorter in other African nations where diesel prices are higher.

Beyond savings, solar power offers energy security, cleaner air, and economic empowerment. For communities long reliant on unstable grids and expensive generators, distributed solar systems are delivering freedom and reliability.

⚡ Distributed Solar Is Leading the Charge

While utility-scale projects are still limited in number, early evidence suggests that much of this growth is being driven by distributed solar—systems installed on homes, shops, offices, churches, and small factories.

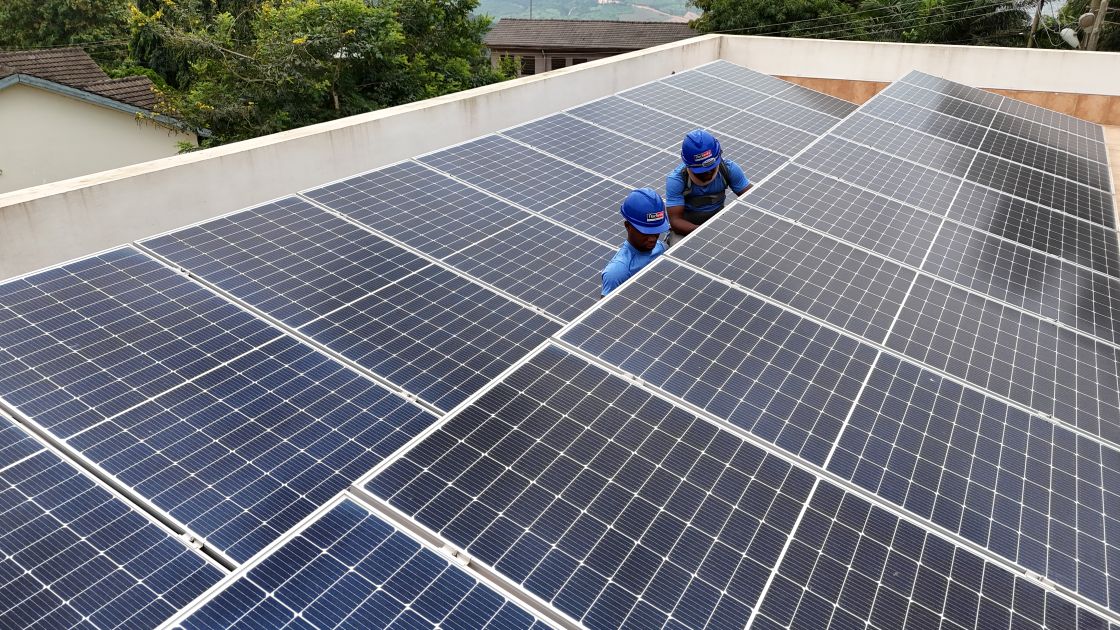
Across Africa’s cities, from Lagos to Monrovia, rooftops are increasingly dotted with PV panels. These small systems, often installed off-grid, are quietly revolutionizing access to clean energy and helping businesses operate through power outages.

This mirrors the pattern seen in Pakistan, which witnessed one of the world’s fastest solar booms. In just a year, Pakistan tripled its solar imports, driven largely by rooftop installations responding to high electricity costs and frequent blackouts. Africa’s conditions are remarkably similar—sun-rich, energy-poor, and hungry for independence.

🏭 Africa’s Solar Manufacturing Is Still Nascent

At present, most of Africa’s solar panels are imported from China, which produced 80% of the world’s supply in 2024.

However, local manufacturing capacity is slowly emerging.

  • Morocco now produces about 1 GW of panels per year.
  • South Africa has similar capacity.
  • Egypt has three major new factories in the pipeline, including EliTe Solar (3 GW in 2025), Sunrev Solar (2 GW in 2026), and Masdar (4 GW).

These projects mark the beginning of a local value-chain evolution, which could generate thousands of green jobs while reducing reliance on imports over the next decade.

🧭 Tracking the Solar Transformation

Data from China’s customs authority (GACC) provides the most complete real-time picture of Africa’s solar growth. Ember’s China Solar Export Explorer updates monthly, offering insights into which countries are scaling fastest.

However, import data only tells part of the story. Solar panels may take months to ship, clear customs, and be installed. Some are stored in warehouses, while others are re-exported to neighboring countries.

To truly understand Africa’s solar rise, researchers and policymakers must combine import data with installation tracking, satellite imagery, and national reporting.

Without timely and transparent data, Africa risks repeating Pakistan’s mistakes—where the government underestimated growth, failed to plan for distributed solar, and struggled to integrate it into the grid.

Africa’s Solar Take-Off: How a 60% Surge in Imports Signals a New Energy Future


🌞 Why This Moment Matters

Africa’s energy future is being rewritten—not from the top down, but from the rooftops up.

Bottom-up energy transitions, powered by affordable solar panels, are now the fastest, cleanest, and most inclusive path forward.

The benefits are enormous:
✅ Lower electricity costs
✅ Reduced fuel imports and foreign exchange drain
✅ Job creation and local industry growth
✅ Cleaner air and environmental resilience

But to make this revolution sustainable, Africa must invest in data, research, and policy alignment. Governments, private companies, and civil society—including organizations like Nocheski Solar—must work together to ensure this growth remains equitable, planned, and inclusive.

🔍 Key Takeaway

The numbers don’t lie: Africa’s solar revolution has begun. A 60% rise in imports within one year is not a coincidence—it’s the start of a continental transformation.

The challenge now is to harness this momentum wisely, building systems that empower communities, strengthen economies, and light up a brighter, cleaner Africa.Acknowledgements

Culled from fron an original article from EMBER

Author: Dave Jones
Contributors: Richard Black, Chelsea Bruce-Lockhart, Daan Walter, Katye Altieri,
Kingsmill Bond, Kostantsa Rangelova, Libby Copsey, Matt Ewen, Rini Sucahyo, Sam
Butler-Sloss, Kavya Sharma.


As Ghana strives towards energy independence and sustainability, solar energy is emerging as a key solution. With abundant sunlight year-round, Ghana is ideally positioned to harness solar power and transform its energy landscape. This article explores the latest trends and innovations shaping the future of solar energy in Ghana, highlighting advancements in technology, government policies, market dynamics, and the integration of electric vehicles that are set to drive the country’s renewable energy revolution.

Advancements in Photovoltaic Technology

One of the most significant trends in the solar energy sector is the continuous improvement in photovoltaic (PV) technology. Newer, more efficient solar panels are being developed, capable of converting a higher percentage of sunlight into electricity. Innovations such as bifacial solar panels, which capture sunlight on both sides, and thin-film solar cells, which are lighter and more flexible, are making solar installations more versatile and efficient. These advancements are particularly beneficial for Ghana, where maximizing energy output is crucial due to the country’s high solar irradiance levels.

Energy Storage Solutions

Effective energy storage is essential for the widespread adoption of solar power. In Ghana, where power outages and grid instability are common, reliable energy storage systems can ensure a steady supply of electricity. Innovations in battery technology, such as lithium-ion and flow batteries, are improving the capacity and lifespan of solar energy storage solutions. Additionally, research into supercapacitors and other emerging storage technologies promises even greater efficiency and reliability. These advancements will enable Ghanaian households and businesses to store excess solar energy for use during nighttime or cloudy periods, enhancing the overall reliability of solar power systems.

Smart Grid Integration

The integration of solar energy with smart grid technology is another trend poised to transform Ghana’s energy sector. Smart grids use digital communication technology to monitor and manage electricity flows, allowing for more efficient and responsive energy distribution. By incorporating solar power into a smart grid, Ghana can optimize energy use, reduce waste, and improve grid stability. Smart meters, demand response systems, and real-time data analytics are some of the tools that can help integrate solar energy more effectively, providing consumers with greater control over their energy consumption and costs.

Government Policies and Incentives

Supportive government policies and incentives are crucial for the growth of the solar energy sector. In recent years, the Ghanaian government has introduced various measures to promote renewable energy adoption. The Renewable Energy Act, for example, provides a framework for the development and utilization of renewable energy sources, including solar power. Additionally, initiatives such as the Solar Rooftop Programme offer financial incentives and subsidies for residential and commercial solar installations. These policies not only make solar energy more accessible and affordable but also encourage investment in the sector, driving further innovation and development.

Solar Financing and Investment

Access to financing is a significant barrier to solar energy adoption in Ghana. However, innovative financing models are emerging to address this challenge. Pay-as-you-go (PAYG) systems, for instance, allow consumers to pay for solar energy in affordable installments, reducing the upfront cost of solar installations. Microfinance institutions and crowd-funding platforms are also playing a role in providing the necessary capital for solar projects. By making solar energy more financially accessible, these models are helping to accelerate the adoption of solar power across the country.Banks such as Ecobank,Fidelity,Stanbic and ABSA have already rolled out products with special lending rates .

Local Manufacturing and Job Creation

The growth of the solar energy sector presents significant opportunities for local manufacturing and job creation in Ghana. Establishing local production facilities for solar panels and components can reduce costs, create jobs, and stimulate economic growth. Training programs and vocational courses in solar technology can equip the workforce with the necessary skills, ensuring a steady supply of qualified technicians and engineers to support the industry. By fostering a robust local solar industry, Ghana can enhance its energy security and reduce its dependence on imported energy sources.

Rural Electrification

Solar energy is playing a crucial role in rural electrification efforts in Ghana. Off-grid solar systems provide a viable solution for remote areas that are not connected to the national grid. Solar home systems, mini-grids, and solar lanterns are being deployed to bring electricity to underserved communities, improving living standards and economic opportunities. These initiatives not only provide clean and reliable energy but also contribute to social and economic development in rural areas.

Public Awareness and Education

Raising public awareness and education about the benefits of solar energy is essential for its widespread adoption. Campaigns and programs that highlight the environmental, economic, and social advantages of solar power can encourage more Ghanaians to consider renewable energy. Schools, community centers, and media outlets can play a vital role in disseminating information and promoting sustainable energy practices. By fostering a culture of sustainability and environmental stewardship, Ghana can ensure long-term support for its renewable energy goals.

Solar-Powered Electric Vehicles

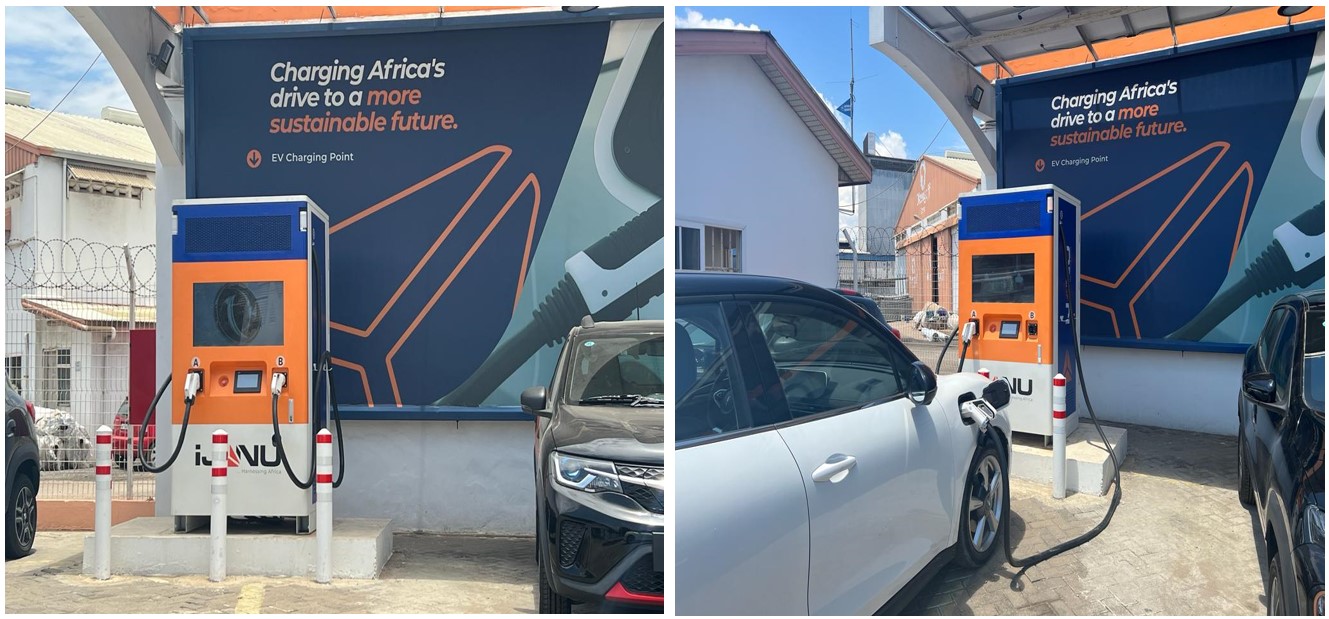
The integration of solar energy with electric vehicles (EVs) is an exciting trend that holds great promise for Ghana. Solar-powered EV charging stations can provide a sustainable and cost-effective way to power electric vehicles, reducing dependence on fossil fuels and lowering greenhouse gas emissions. This synergy between solar energy and EVs can help address the country’s transportation energy needs while promoting cleaner air and a healthier environment. Additionally, advancements in EV battery technology and the expansion of charging infrastructure will support the growth of EV adoption in Ghana, further enhancing the role of solar energy in the country’s energy landscape.Brand such XPeng G6 , BYD Dolphin ,Geely Radar RD6 · BYD Seagull , Fang Sheng Bao can be seen on the streets of Accra on the daily basis.

Conclusion

The future of solar energy in Ghana is bright, with numerous trends and innovations driving the sector forward. Advancements in photovoltaic technology, energy storage solutions, smart grid integration, supportive government policies, innovative financing models, local manufacturing, rural electrification, public awareness, and the integration of solar energy with electric vehicles are all contributing to the growth of solar energy in the country. As Ghana continues to harness its abundant solar resources, it is poised to become a leader in renewable energy in West Africa, achieving greater energy independence, economic development, and environmental sustainability. By staying at the forefront of these trends and innovations, Ghana can secure a sustainable energy future for generations to come.


Energy is expensive and is becoming more expensive by the day.

It’s very likely that energy costs are a significant proportion of your businesses’ outgoings, so keeping those costs under control – and reducing them if possible – is important for maintaining profitability and achieving future success.

There is no shortage of organisations that are only too pleased to offer their services to help you do this – for a fee, naturally! The usual promise is that they will find you a cheaper energy supplier and there is, of course, nothing wrong with that. The Department of Energy and Climate Change has repeatedly said that almost every business can benefit by shopping around for energy and being prepared to change supplier to get a better deal.

But we urge you take a wider view. Don’t think only about how much you pay per kWh for your energy, think also about how effectively you use the energy on which you’re spending your hard-earned cash. To introduce you to the way we think, here’s a simple but rather illuminating analogy.

If you discovered that your car was using more fuel than it should, and you found out that the fuel tank was leaking, what would you do? Would you try to keep your fuel costs under control by finding a garage that sold cheaper fuel, or would you have the leak fixed? The right answer, of course, would be to do both, but repairing the leak would surely have to be the priority!

Now let’s look at this in terms of business energy usage. Almost all businesses in this country are leaking energy – studies by the Carbon Trust show that, typically, savings of around 20% are possible – so it’s essential to fix this leak rather than simply rely on finding a cheaper energy supplier. And, of course, there’s another very good reason for fixing the leak: the effect on the environment. A cheaper energy supplier may reduce your energy bills, but it will do nothing to improve your carbon footprint!

So how do you go about finding and fixing the energy leaks in your business?

Simple! The series of articles below provide the answers in the form of useful suggestions that are practical, cost-effective and easy to implement, so feel free to go ahead and check them out. You can also read the full version of our more comprehensive white paper, which will give you a good overview of what you need to look out for in order to get the most out of the energy you pay for.

No business deliberately wastes energy but, on the other hand, there is almost certainly no business where energy savings can’t be made. The key is to identify the opportunities for savings. Fortunately, many of these tend to be the same, or at least very similar, in every business and experience shows that they can be divided into two categories: those that relate to the general workplace environment, and those that relate to technical aspects of the electricity supply. Let’s take a look at some of the most important of these energy-saving opportunities, starting with lighting.

When changing to new light sources or considering automatic controls for lighting, it is of course essential to ensure that light levels remain adequate and meet the requirements of the CIBSE SLL Code for Lighting. This can be achieved by using a light meter, but it’s important to note that not all of these are suitable for assessing light levels in workplaces. Features that should be considered essential are built-in spectral and incidence correction, as well as the ability to display results in Lux. Mapping functionality is also extremely useful as it makes it much easier to ensure that lighting coverage is satisfactory throughout the premises


It’s easy to dismiss lighting as a relatively small consumer of energy compared with, say, heating so it is perhaps surprising to learn that lighting typically accounts for up to 40% of a building’s electricity consumption. There are, however, relatively straightforward ways of reducing this figure and one of the most e ective of these is to change to LED light sources. Admittedly this is likely to involve some investment and some e ort, but when you realise that LEDs use around 80% less energy than an incandescent lamp with the same light output, it’s easy to see that the changeover costs will be recovered very quickly.


And there’s another factor to bear in mind. With a typical operating life of around 50,000 hours, LED light sources last about 25 times longer than regular halogen lamps.Therefore, as well as cutting energy usage, switching to LED light sources will also deliver big savings in maintenance costs.


Switching to LEDs is not the only way to reduce lighting energy bills – switching the lights o can also yield big savings. The key, of course, is to turn lights o when they’re not needed. On winter mornings and in dull weather, when natural light levels are low, it’s quite usual and fully justified for sta to turn on the lights when they get to work. Later in the day, however, when the natural light levels are higher, how often do they remember to turn the lights o ? Systems that automatically turn o the electric lights when natural light levels are adequate are readily available and are well worth considering.

a logging light meter, such as the Chauvin Arnoux C.A 1110,– C.A 1110 Lightmeter


Another big issue that affects not only lighting but also heating is unnecessary out-of-hours usage. Shockingly, a recent British Gas survey of 6,000 SMEs with smart meters found that no less than 46% of their energy consumption occurred outside their normal business hours. This is not necessarily all wasted energy; most businesses need some out-of-hours lighting and heating especially in the winter months. But when almost half of their energy is used out of hours, there is clearly an opportunity to make savings.


Effective time-controlled switching, which ideally adjusts on and off times according to the seasons and takes into account shutdown and holiday periods as well as weekends, is part of the answer. Also the use of occupancy-controlled switches that will turn o lights and reduce heating levels in intermittently occupied areas, like meeting rooms, when they are not in use.

It’s worth noting, however, that before such systems are installed, it is essential to carry out an energy monitoring survey – as will be discussed later – to determine exactly where the out-of-hours energy is being used. Maybe it’s not just the heating and lighting. Maybe computers and o ice equipment, items often left on out of hours, are equally culpable; an energy survey will provide the answers and make it much easier to take the appropriate remedial action.


Better control over heating and lighting is a reasonably obvious route to saving energy, even though many businesses still fail to make the most of this opportunity. Slightly less obvious is better overall environmental control. Consider draughts and ventilation, for example. Good ventilation, or at least good circulation of air, is essential in every working environment to prevent the build-up of carbon dioxide (CO2) which makes workers drowsy and ine icient. But poorly designed ventilation systems can create draughts that not only reduce comfort levels but also unnecessarily remove heat from the building

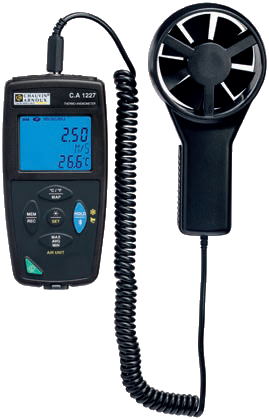
– C.A 1227 Thermo-anemometer


These aspects of the environment are, however, easy to measure and monitor. Inexpensive, easy-to-use equipment is now available that will accurately measure airflow, CO2 levels, temperature and humidity in the working environment and, with some types, log the results over time so that variations throughout the day and even throughout the year can be seen. These results provide useful insights that not only help with achieving energy savings, but also make it easier to demonstrate that working environments meet the requirements of standards and guidance such as the Workplace (Health, Safety and Welfare) Regulations 1992, HSE Thermal Comfort guidance and EH40/2005 Workplace Exposure Limits.


Though not as obviously related to the workplace environment as, for instance, lighting, electric motors play an important role in almost every business and are big consumers of energy. In fact, according to the Carbon Trust, motors consume about two-thirds of the energy used by UK industry, and the running cost of a motor for a year can be as much as ten times what it cost to buy it in the first place. Clearly, energy e iciency in relation to motors is an important topic. And, should you be thinking that motors don’t play a significant role in your particular business, remember all those motor driven fans and pumps in your building’s climate-control systems.


Because of the importance of motor e  iciency, this is now covered by an international standard, the latest version of which is IEC 60034-30-1. This divides motors into five e  iciency classes, IE1 to IE5, with IE5 motors being the most efficient. If you’re in a position to specify new motors, it is always worth choosing the higher efficiency types. These now cost little if any more than ‘ordinary’ motors, yet they can typically reduce running costs by between 3 and 5%.


Another thing to consider in relation to motors is whether they should be fitted with variable speed drives (VSDs). In many older climate control systems fan motors have simple on-o control, so they are either running at full speed or they are stopped. When they’re running at full speed, unless the weather is particularly hot, the fans produce too much air flow, so this has to be controlled by throttling and the use of dampers. Unfortunately, these devices do nothing to reduce the amount of energy consumed by the motor.


A much better approach is to fit a VSD so that the speed of the motor can be adjusted to provide the exact level of airflow needed at a particular time. The situation with pumps is very similar and, in both cases, it is quite usual to find that the motor operates at 80% of full speed or less almost all of the time. Since a fan or pump motor running at 80% speed consumes only half the energy it would when running at full speed, it’s easy to see that very big energy savings are possible, and that the cost of buying and fitting the VSD will be recovered very quickly

Having briefly dealt with energy-saving opportunities that relate to the workplace environment, let us now move on to the second group of opportunities that was mentioned in the beginning of this section: that is, opportunities that relate to technical aspects of the electricity supply. The most important of these, by a very wide margin, is power factor, which is dealt with much more fully in a later section.


A short explanation, however, is that the energy consumed by electric motors (and many other types of electrical device) is made up of two components: the useful component that turns the motor and the useless component (or to use a rather more formal term, the wattless component) that does absolutely nothing worthwhile. The catch is that you, as a non-domestic consumer, pay just as much for the useless power as you do for the useful power.


Fortunately, it’s easy to measure the amount of wattless power that an electrical system is consuming, and to install equipment that will greatly reduce this without a ecting the performance of the system in any way. This is known as power factor correction. It’s inexpensive, reliable and, in very many cases, it will deliver big savings and when it’s in place, you will no longer be throwing money away in return for “useless power”.


A second technical aspect of the power supply that’s worthy of attention is phase voltage imbalance. The voltage on all three phases should ideally be the same. In the real world, small deviations are inevitable but they should be very small because, for given percentage voltage imbalance, the resulting increase in current can be ten times greater. In other words, a 2% voltage imbalance can produce a 20% increase in the current in the phase a ected. This is bad news not only in terms of energy consumption, but also because the higher current will generate more heat in the motor, leading to an increased risk of failure.


Finally, it’s important to look at harmonics in the power supply. These are currents at frequencies that are integer multiples of the power supply frequency so, for a 50 Hz system, the harmonic currents will be at 100 Hz, 150 Hz, 200 Hz, 250 Hz and so on. The e ect of harmonics is, once again, to produce additional heating in the load, and they also figure in the amount of energy for which you are billed

As with power factor, phase imbalance and harmonics can readily be measured and recorded. Remedial action is not quite as straightforward as it is with power factor. It will be necessary to trace the source of the problem and, in most cases, corrective measures will have to be put in place at the source. The e ort will, however, be well worthwhile.


This section has looked at areas where most, if not all businesses, can make worthwhile energy savings. Most of these are summarised in the table below, which is based on data from a number of reliable sources including the Carbon Trust and British Gas.


Potential
Saving
E ective energy e  iciency measures 20%
Average SME out-of-hours usage 46%
Occupancy sensor controlled lighting 30%
Automatic daylight adjustment for lighting 40%
LED lighting in place of incandescent 80%
Power factor correction 30%


To control, you must measure

A clear message from the previous section is that energy control is the key to energy e iciency. But it’s an almost universally accepted fact that, if you want to control something, you first must be able to measure it. That’s certainly true when it comes to energy. To make savings, you first need to understand your energy usage and that’s not something you can do by relying on intuition or guesswork. How many businesses, for example, would estimate that lighting accounts for 40% of their energy costs? Yet that is, as already mentioned, the typical figure.


And there’s also another aspect to energy measurement. Suppose you decide on some energy saving measures and implement them. How do you know how well they’ve worked? Sure, your energy bills may have gone down, but have you reduced energy usage by as much as you expected? Or by as much as you could have? If the bills start to climb again, what’s gone wrong? Measurement is the only way to provide dependable answers to these questions. Ideally, the procedure should be to measure and analyse energy consumption, implement energy saving measures, then measure and analyse the consumption again. The before-and-after figures will reveal the success of the measures, and subsequent ongoing measurements will confirm the continuing e ectiveness of the measures.


These ideas are, in fact, reflected in national and international standards and protocols. The ISO 50001 standard, for example, requires organisations to “establish, implement, maintain and improve an energy management system, whose purpose is to enable [the] organisation to follow a systematic approach in achieving continual improvement of energy performance, including energy e iciency, energy security, energy use and consumption.” Similarly, the


International Performance Measurement and Verification Protocol (IPMVP) is “a framework document describing shared best practices for measuring, calculating and monitoring the savings achieved in the context of energy e iciency projects.”


The requirements of ISO 50001 clearly imply a need for measurement, for how else can “continual improvement” be assessed, and the IPMVP explicitly mentions “best practices for measuring … and monitoring”. But what is the best way to monitor, in detail and over time, the energy consumption of electrical installations? Many modern distribution and energy management systems actually

incorporate energy monitoring and logging facilities, but it’s important to check on their capabilities before relying on these. Often, they have only a limited amount of memory, which means they’re unable to store results over extended periods of time, and many integrated monitors store only summary data that doesn’t provide the level of detail needed for truly e ective energy optimisation.


Fortunately, the latest generation of portable power and energy loggers (PELs) provides a convenient, cost-effective and altogether more capable alternative. Modern PELs are compact, lightweight electronic monitoring instruments that have been developed specifically to make it easy to collect electrical data. They can be temporarily placed in distribution panels, or even around the premises, without difficulty and without the need to interrupt the mains supply or turn equipment off . The flexible current coils are simply looped around the phase conductors,while the magnetic voltage probes stick to the screw


heads on the MCBs – although they can, of course, also be wired in if additional security of connection is needed.

– Chauvin Arnoux PEL 103
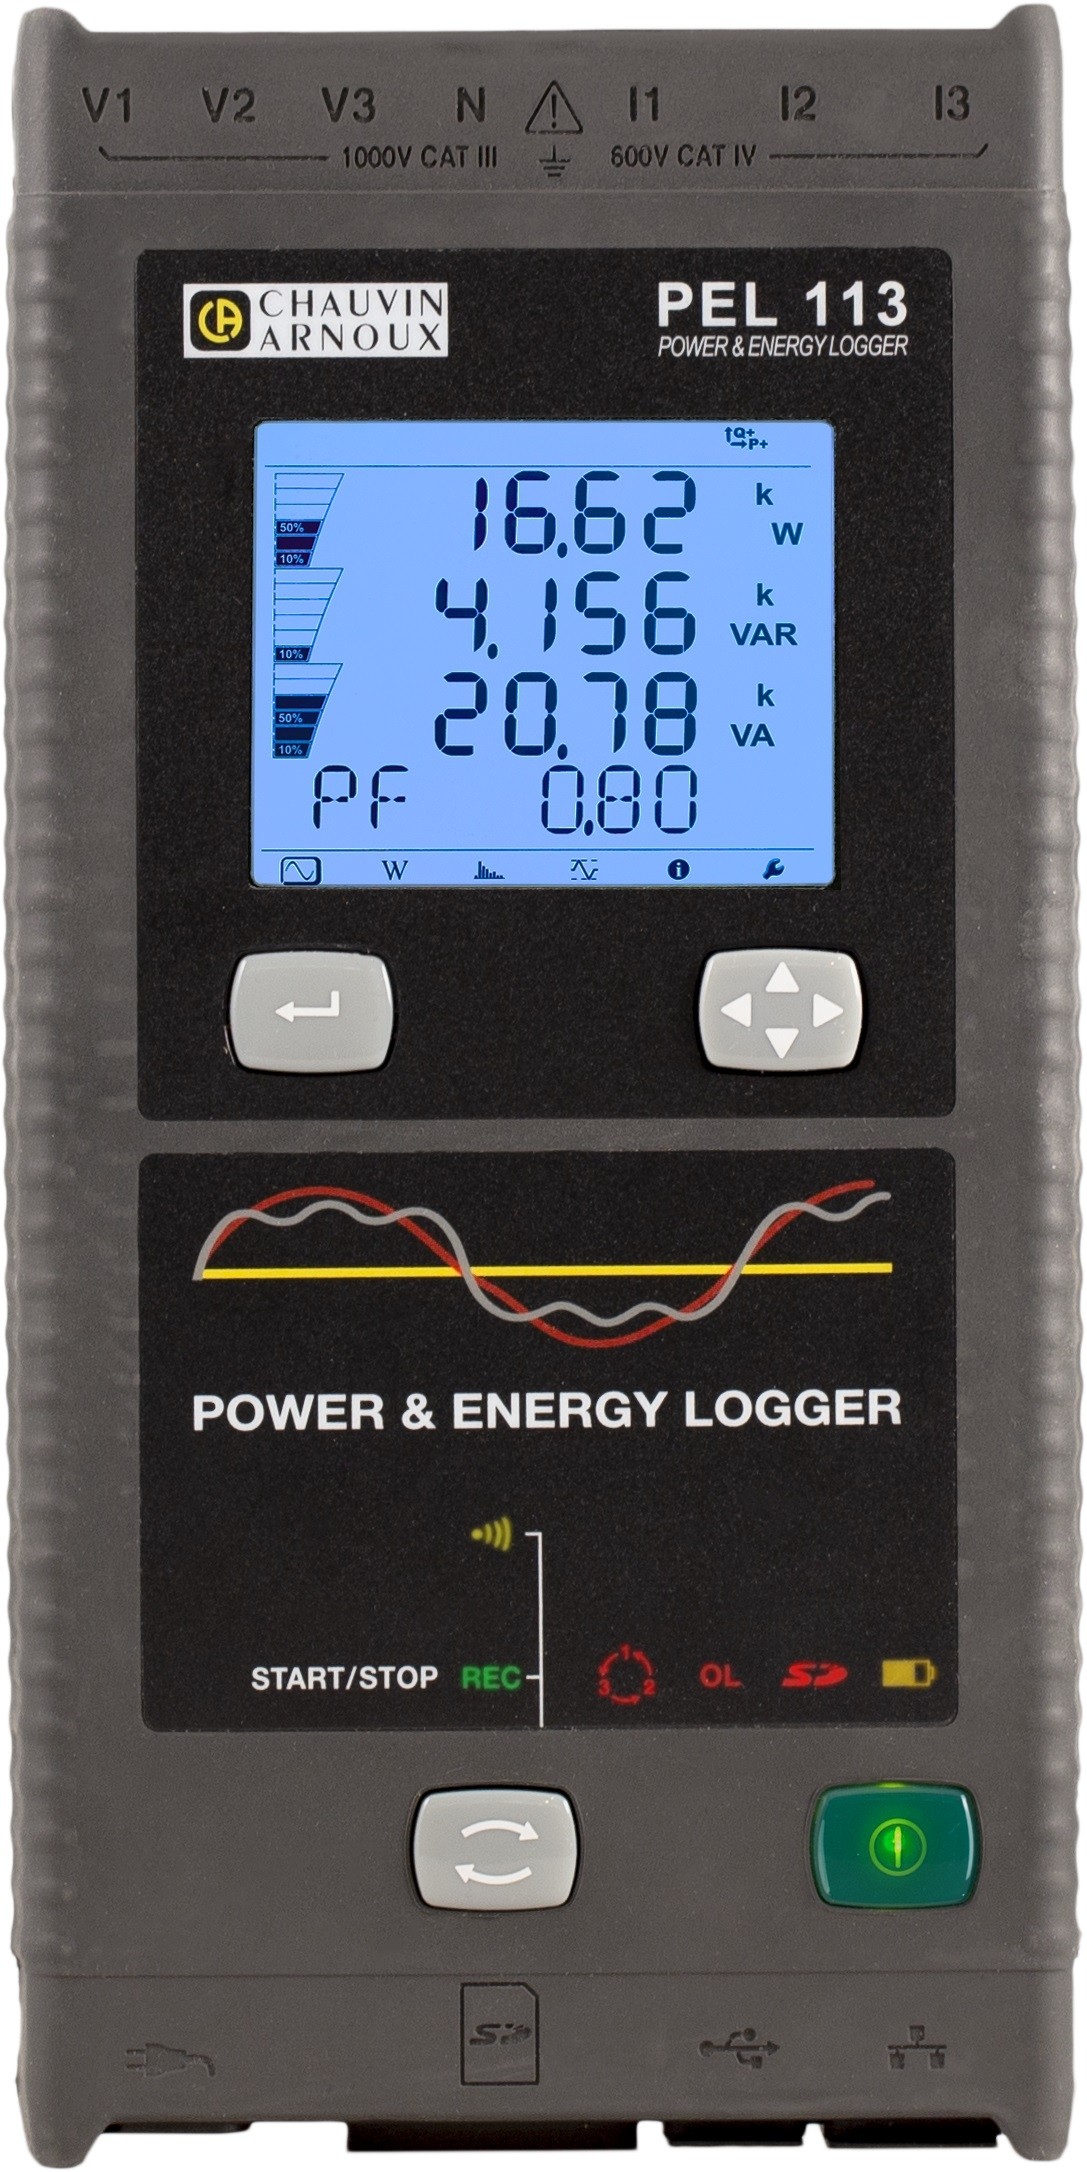
The PEL 113 measures and records all the power and energy values.
It can be used wherever there is electricity:
• electricity generator: renewable energies, thermal energy, etc.


PELs gather data and calculate key electrical parameters such as three-phase current power and energy, along with phase angle, power factor, and harmonic levels

The best instruments of this type can store millions of readings, collected automatically over time, and this data can be retrieved locally or remotely via a USB or Ethernet connection, or a wireless Bluetooth link. In large premises or where a business operates from multiple premises, it’s often convenient to install PELs in several di erent places. Data from all of them can be retrieved to a single location, without the need to visit each PEL to interrogate it. PELs can also be moved round an installation to provide convenient local monitoring of departments or even individual items of equipment.

PELs are often used for short-term measuring and monitoring, but they can also be installed permanently. Better models feature slim designs and a magnetic back, so they are easily accommodated even where space is limited, and they need no installation other than simply sticking them to the steel door or wall of a distribution cabinet. Unlike older instruments, they don’t need equipment to be turned o and isolated so that doors can be drilled and cut-outs made. These are very important benefits as the di iculty and cost of fitting traditional instruments has often deterred businesses from installing the monitoring equipment that will unlock large energy savings.


– Chauvin Arnoux PEL 103


Once your business has invested in a PEL, or indeed several PELs, the next step is to carry out an energy audit, to establish a baseline against which improvements can be judged. With a PEL, this is a simple process. The PEL is set up to monitor key circuits – some PELs can simultaneously monitor multiple circuits – and is left in place to collect data over a representative time period.

The actual period will depend on the application. For a continually running process line, one day might be enough, but more typically a week or even a month will be more appropriate.


The data is then downloaded from the PEL and can be readily visualised and analysed using software supplied by the PEL manufacturer. Audit reports can also be produced for future reference so that the e ects of energy economy measures can be readily evaluated. The data from the PEL will show immediately where the most energy is being used and, therefore, where there is likely to be the most potential for making improvements. Based on this information from the audit, an informed decision can be made about the type of improvements to implement and where to implement them.

– Current over time graph on DataView®


The audit will also provide the information needed to formulate a metering plan, which is simply a plan to measure energy usage over extended time periods. This is essential not only to gauge whether energy e iciency measures are e ective in the short term, but also whether they remain e ective in the long term – they might be nullified, for example, by faulty equipment – and whether there is room for further improvement, in line with the aspirations identified in both ISO 50001 and IPMVP for “continual improvement”.


Rules, guidelines and requirements


Cost may be the driving force for reducing energy usage in many businesses but there’s another reason that’s arguably even more important: climate change. It’s almost universally accepted that, if we don’t take drastic steps to cut our carbon emissions – starting now – the consequences for the future of our planet are likely to be dire and the damage we are doing irreparable.


6

Climate change in itself should be a su iciently compelling reason to reduce energy usage, but there’s also another factor: if we don’t reduce energy consumption, it’s perfectly possible that, in the not-so-distant future, there will not be enough generating capacity to meet our needs. National Grid has recently warned that by 2030, electric cars could require between 3.5 and 8 GW of additional generating capacity on top of the current peak demand of 60 GW. And to put that in perspective, the new Hinkley Point C nuclear power station currently under construction will add just 3.2 GW of capacity.

Every business today must, therefore, be conscious of its energy usage and its carbon footprint and work continually toward reducing them. As we shall see shortly, this is backed up by legislative requirements, but it’s worth bearing in mind that there’s another factor: tenders for many lucrative contracts now require those tendering to explain their environmental policies and demonstrate their e ectiveness. Failure to do so means disqualification from the tender process and inevitably loss of business.


In other words, if you’re a business owner or manager, you simply cannot a ord to neglect the environmental impact of your operations – and there’s plenty of legislation to make sure that you don’t.


Most of this has its roots in the Kyoto Protocol, which was adopted by 192 countries of the world, including the UK, in December 1997 and came into force in February 2005. The objective of the Protocol, in simple terms, is to reduce greenhouse gas emissions to a level where they will no longer alter weather patterns


Based on its commitment to the Kyoto Protocol, the UK government introduced the Climate Change Act 2008, which committed the UK to reducing greenhouse gas emissions by 80%, compared with the 1990 baseline, by 2050. An interim target of a 34% cut by 2020 was subsequently made legally binding in April 2009 budget statement and, in 2019, a new target of ending the UK’s contribution to global warming completely by 2050 became law.


To ensure that businesses play their part in achieving


these challenging targets, the government included


the CRC Energy E iciency Scheme as part of the Climate


Change Act. On 1st April 2019, however, this was superseded


by the Streamlined Energy and Carbon Reporting (SECR)


policy, as implemented by the Companies (Directors’


Report) and Limited Liability Partnerships (Energy


and Carbon Report) Regulations 2018. According to the


Carbon Trust website, “the new regulations will require


an estimated 11,900 companies incorporated in the UK


to disclose their energy and carbon emissions – a far greater number than were required to act under the CRC.”


The regulations apply to companies with at least 250 employees or an annual turnover greater than £36m, as well as an annual balance sheet greater than £18m. Companies reporting into the SECR will also include those in the Energy Saving Opportunities Scheme (ESOS). If a business meets the criteria it will be automatically entered into the scheme and details of its energy use and carbon emissions, as well as its actions to improve energy e iciency, will be made publicly available, alongside reference metrics.


For businesses that haven’t already thought about increasing energy e iciency, compliance with SECR will involve additional costs for administration and possibly for equipment purchase. However, if e ective energy e iciency measures are implemented, this outlay will be rapidly recovered. To achieve this, companies should embrace an energy management system that includes people, processes, and technology, and go back to the basics of energy management by analysing their operations to understand the meaningful and sustainable changes that can be made.


Supporting businesses in their endeavours to improve energy e iciency, whether or not they are covered by the SECR, is the international ISO 50001 standard which, as mentioned in an earlier section of this white paper, aims to help organisations continually reduce their energy use, and the International Performance Measurement and Verifica-tion Protocol (IPMVP), which was also mentioned earlier.It is worth looking at the IPMVP in some detail, because it is part of a very practical approach for controlling, optimising and reducing energy costs by measuring technical and economic performance. It explains how to define a standardised procedure for auditing, measurement and verification of energy performance, and is now the most widely used framework for this purpose.

At the heart of the IPMVP framework there is a written ‘Measurement and Verification Plan’ which is formulated to ensure repeatable measurement campaigns so that the results of subsequent analyses are comparable and reliable. This preparation of the plan is an essential foundation for any energy e iciency project and involves drafting a complete procedure and documenting all the points where measurements will be made.


In energy e iciency projects, an exhaustive approach is essential. All the parameters that may have a significant influence on energy savings have to be measured, and the measurements must be considered in the context of the site as a whole. This will allow energy budgets to be managed precisely and will underpin the validity of the actions specified in the measurement and verification plan.

The definition of the content of the reports and the precision of the performance measurement methodology are crucial features for establishing the credibility of the Measurement and Verification Plan and for ensuring that it is accepted by all stakeholders. The accuracy of the measurements, the equipment used for monitoring and the test procedures all contribute to assessing the improvements made and, ultimately, the return on investment. A detailed and well-structured Measurement and Verification Plan will therefore encourage investors to finance energy saving projects.


The IPMVP methodology divides implementation into four phases:


Phase 1: Define requirements and make measurements


It is essential to start by producing a historical, comparative analysis of consumption. The first step is to analyse the bills from electricity suppliers, but these will only provide information about the total consumption of the site. It is therefore necessary to subdivide the consumption and allocate it across the various users of electricity on the site – for example, factory, workshop, production line, o ice areas, etc. Doing this involves real-time monitoring and logging of consumption for each user, followed by the creation of reports, charts and summaries.


Phase 2: Plan and implement solutions


On the basis of the measurements and analyses performed in Phase 1, an investment plan is developed which gives details of the energy-saving measures to be adopted and their expected outcomes. Once the investment is approved, the plan is implemented. Examples of the measures that frequently form part of such plans are switching to LED lighting, changing electric motor control systems to allow variable speed opera-tion, replacing old motors with modern high-e iciency types and taking steps to ensure that lighting and equipment is always turned o when it is not needed. Note that energy saving measures may also be needed for non-electrical systems, such as those that consume gas and compressed air. It is also worth remembering that eliminating waste is an important way to achieve energy savings, but it should always be accompanied by best possible energy e iciency in every situation.

8

Phase 3: Measure and verify improvements


A measurement campaign is carried out to ensure that the expected savings are actually being achieved. Measurements should be made that allow the results of each energy saving measure to be compared directly with the initial objectives. Any measure that falls short of these objectives should be reassessed and, if necessary, modified.


Phase 4: Ongoing periodic testing

Improving energy e iciency isn’t a once-and-for-all-time action! Equipment can fail or degrade, and over time, operating conditions can change. To allow for this, a procedure must be set up for testing periodically – typically every six or twelve months. The tests must be exhaustive and should look at all of the elements of the on-site installations. In the case of the electrical systems, these will often include the lighting network, the general single-phase distribution network and the three-phase distribution network as well as, in many cases, standby generators and uninterruptible power supplies (UPSs).


In summary, all of the standards and regulations mentioned in this section recognise, either implicitly or explicitly, that accurate and detailed measurements are an essential requirement for optimising energy e iciency, supervising electrical networks and allocating costs fairly. Regular measurement of performance is the only way to guarantee long-term energy e iciency.


Power factor: paying for electricity you don’t use


Power factor was briefly mentioned earlier in the context of reducing energy costs and now it’s time to consider this important topic in more detail. The headline news, however, is simple and shocking: if your electrical systems have a poor power factor, you are regularly paying out large sums of money for electricity you don’t – and can’t – use!


This is not a new issue; for decades, experienced engineers looking after industrial and commercial sites have put measures in place to ensure that their sites had a good power factor. But today, fewer and fewer sites have such engineers to take care of them and, as a result, power factor gets forgotten and the inevitable result is needlessly inflated energy bills. But what actually is power factor, and why is it so important?

The key to the explanation is that some types of electrical equipment used in industrial and commercial applications consume a certain amount of reactive power in addition to the real (or active) power they need to do the job for which they are intended. These are often inductive devices – that is, devices that incorporate coils of wire as part of their construction. Examples are motors, induction heaters, arc welders, compressors and most types of fluorescent lighting. It’s important to understand that the reactive power doesn’t, as far as the user of the equipment is concerned, do anything useful.


Technically speaking, reactive power is the vector di erence between the real or active power used by a device, and the total power it consumes, which is known as the apparent power. And power factor is the ratio of the real power to the apparent power. A device with a low power factor – which is more often called a poor power factor – draws more current than a device that’s doing an equal amount of useful work but has a high (or good) power factor. Higher currents increase energy losses in the electricity distribution system, so energy suppliers penalise customers that have a poor power factor by charging them more for their electricity.


Reactive power is measured in kVAr (kilovolt-amperes reactive), active or real power is measured in kW (kilowatts) and apparent power is measured in kVA (kilovolt-amperes).


Speaking less technically, this scenario can be made rather easier to understand by thinking about beer! If you order a pint of draught beer, the whole glass you pay for is equivalent to the apparent power. But take a closer look – that beer has got a frothy head on it! The beer is the part you really want, and that’s equivalent to the active power, while the head, which makes no

contribution to your refreshment, is equivalent to reactive power. A pint glass full of beer, with no head, would represent a power factor of 1 with no reactive power at all. In reality, that’s usually impossible to achieve and a power factor of 0.95 (corresponding to less than 5% froth!) or better is usually considered acceptable.


So far, so good, but if electrical equipment inherently consumes active power, what can be done about it? Fortunately, it is possible to correct for power factor by adding, logically enough, a power factor correction (PFC) system. This usually takes the form of capacitors connected at the main distribution board, or sometimes at other locations.


Many sites will already have some form of PFC but, as implied earlier, it is not quite a fit-and-forget solution. If more equipment is installed on a site, or the type of equipment used on the site is significantly changed, the PFC system may no longer be adequate. It’s also worth noting that capacitors used for PFC can degrade over many years of service and may eventually need to be replaced.


In fact, according to The Carbon Trust it is not uncommon for industrial installations to be operating with high levels of reactive power giving power factors of between 0.7 and 0.8. This is surprising and totally unnecessary since measuring power factor is not at all di icult. It can be readily measured using portable test instruments, or alternatively, can be permanently monitored in real-time with constantly displayed values, along with a multitude of other useful parameters including voltage, current and energy consumption.


While specification of a PFC system to reduce reactive power requires knowledge of several factors including the voltage level and typical usage of the reactive loads on-site, the usage profile across the site, and the power quality required by the on-site loads, all of these are easily measured and/or calculated. And a properly designed PFC system will be a fraction of the cost of the savings it delivers.


The simplest form of PFC involves fitting capacitors, but it is worth shopping around and taking expert advice to find a system that will accurately suit your particular requirements. If a single machine has a poor power factor, capacitors can be connected in parallel with it, so that they compensate for the poor power factor whenever the machine is switched on. Alternatively, if the power factor of a site is permanently poor and no single item of equipment is solely responsible, fixed PFC can be connected across the main power supply to the premises.

In more complex applications, where many machines are switched on and o at various times, the power factor may be subject to frequent change. In this case the amount of PFC needs to be controlled automatically by switching banks of capacitors into and out of circuit, as required. And in facilities with large non-linear loads, with their associated harmonic currents, it may be necessary to use a de-tuned PFC system. Numerous solutions are available on the market to provide such functionality, but expert advice should always be sought if you are in any doubt.

A Power Factor Correction Case Study


In June 2016, a request was received from a metal fabrication business to monitor its electricity usage. Monitoring was carried out over a period of four days, and the results are shown in the blue column of the table below. It can be seen that the average power factor, measured over those four days, was 0.73. To put that into perspective, a power factor of 0.7 requires approximately 43% more current to do the same thing as an installation with unity power factor.


After the installation of appropriate automatic power factor correction equipment in January 2017, the average power factor the monitoring exercise was repeated, this time for a whole week. The results are shown in the green column of the table, and this time the power factor averaged 0.98. The apparent power was reduced by just over 13%. Current dropped by between 10% and 17% per phase, and reactive power was reduced from 119 kVAr to less than 8 kVAr. These reductions were achieved even though there was a slight increase in demand during the 6 months between the two sets of measurements.


Monitoring 29/6/2016 – 1/7/2016 Measured Monitoring 3/1/2017 – 10/1/2017 Measured
Voltage (V) 414.00 Voltage (V) 417.90
Power Factor 0.73 Power Factor 0.98
L1 (A) 313.10 L1 (A) 284.60
L2 (A) 312.90 L2 (A) 260.80
L3 (A) 287.50 L3 (A) 248.70
Power (Kw) 171.50 Power (Kw) 182.48
Apparent Power (KVA) 210.20 Apparent Power (KVA) 184.41
Reactive Power (KVAr) 119.30 Reactive Power (KVAr) 7.54


Based on a real-to-apparent power di erence prior to the power factor correction of 38.7 and a real-to-apparent power di erence after the power factor correction of 2, and assuming an electricity cost of £0.15 per kWh, this equates to a saving of over £8800 per year in electricity costs.


Credit for this case study goes to Power Quality Improvement Services (PQIS

Action this day!


If this white paper has made it clear that finding a cheaper energy supplier is not the only – nor necessarily the best – way of cutting your energy bill (and, by the way, protecting our precious planet), then it has achieved its purpose. Or at least it will have if you act on the ideas and suggestions above. It’s all too easy to put a document like this to one side with the full and genuine intention of acting on its recommendations at some future date. The danger is that the future date may never arrive! So why not start to plan your new energy strategy right now? Here are some of the actions you may want to consider including:


Buy some kit for measuring and monitoring


To identify the best opportunities for saving energy, you’re going to need measuring equipment, most likely in the form of portable energy loggers (PELs). You can hire these, but you’re likely to find that buying them outright is a better option because you’ll want to monitor your installations for extended periods as an aid to planning your actions and, of course, when you’ve put your energy saving measures in place, you’ll want to carry on measuring and monitoring to confirm their e ectiveness.


Start measuring and monitoring to establish a baseline


Decide on a date to start your measuring campaign and stick to it! Make sure that you choose the start date and the period your campaign covers so that you record typical data for your installations. Measuring energy consumption over the Christmas break, for example, probably won’t give you the information you need. And don’t be in too much of a hurry – within reason, the longer the period over which you collect data, the more useful will be the results.


Analyse your data and decide on the next steps


The data from your measurement campaign will almost certainly reveal areas of your business that are ripe for energy savings. Simple but very common examples include changing to LED lighting and ensuring that lighting and heating is turned o , or at least turned down, when it’s not needed. Use your measurement data to plan your changes, and don’t forget to quantify the results you expect each change to deliver.


Make the changes!


Remember to ensure that you’ve got all the materials and labour resources you need lined up for the date you plan to make the changes. Then go ahead and make them.

Keep on measuring and monitoring


Measuring and monitoring after you’ve made your changes is just as important as it was before you made the changes, because you need to know how e ective your actions have been. As always, measuring and monitoring should cover typical operating periods for your business.


Evaluate your results


Carefully compare your before and after measurements. Did each of your energy saving actions deliver the results expected of it? Should some of your actions be fine-tuned, extensively modified or even abandoned? Do the new results suggest further energy saving actions that might be useful? Could actions similar to those that have been successfully applied in one part of your business be equally successful in other parts?


Keep on measuring and monitoring


Optimising energy e iciency is not something you do once and then forget! It’s a way of life, an ongoing process that has continuing measurement at its core. After all, even if your initial energy saving e orts are every bit as e ective as you hoped, there’s no guarantee that they’ll remain e ective indefinitely; even the best equipment can break down and it its performance will almost certainly deteriorate as it ages. On-going monitoring will help you to spot these issues and deal with them promptly. And, who knows, it may also help to identify even more ways of saving energy and money.


A final note


We at Chauvin Arnoux hope you have found this white paper to be informative and useful. We also hope that it will help you to save money and to reduce the environmental impact of your business operations. We’ve tried to present the information as clearly as possible but there’s no doubt that energy e iciency is a complex subject.


So, if you’d like further information about the ideas we’ve put forward, or if you’d like help with starting your own energy-e iciency campaign, please get in touch with us. Talking to Chauvin Arnoux won’t cost you a penny, but it could save you a fortune – and help to save our planet.

Solar energy in Ghana is no longer just an option. It’s a necessity. As electricity rates rise and power instability continues, more homes and businesses are choosing solar power for sustainable, reliable, and cost-effective energy. Nocheski Solar is at the center of this change. This leading solar power company in Ghana is known for precise engineering, quality European components, and expert solar panel installations that deliver solid results.

Why Solar Energy in Ghana is Booming

Ghana receives plenty of sunshine, averaging 5.5 hours of peak sunlight daily. This makes it ideal for solar energy solutions. From residential rooftops to large commercial projects, solar power installations are quickly altering how the country consumes energy.With growing government interest in renewable energy and falling solar equipment prices, Ghana is entering a new energy era. Innovative companies like Nocheski Solar are leading this movement with high-quality technology and unmatched technical skills.

Nocheski Solar: Powering Ghana’s Clean Energy Transition

Founded in 2007, Nocheski Solar has become one of the most trusted solar installation companies in Ghana. Our team of engineers and technicians has years of experience designing and implementing systems tailored to local needs and climate conditions.

We specialize in:

– Solar panel installation for homes, offices, and industries
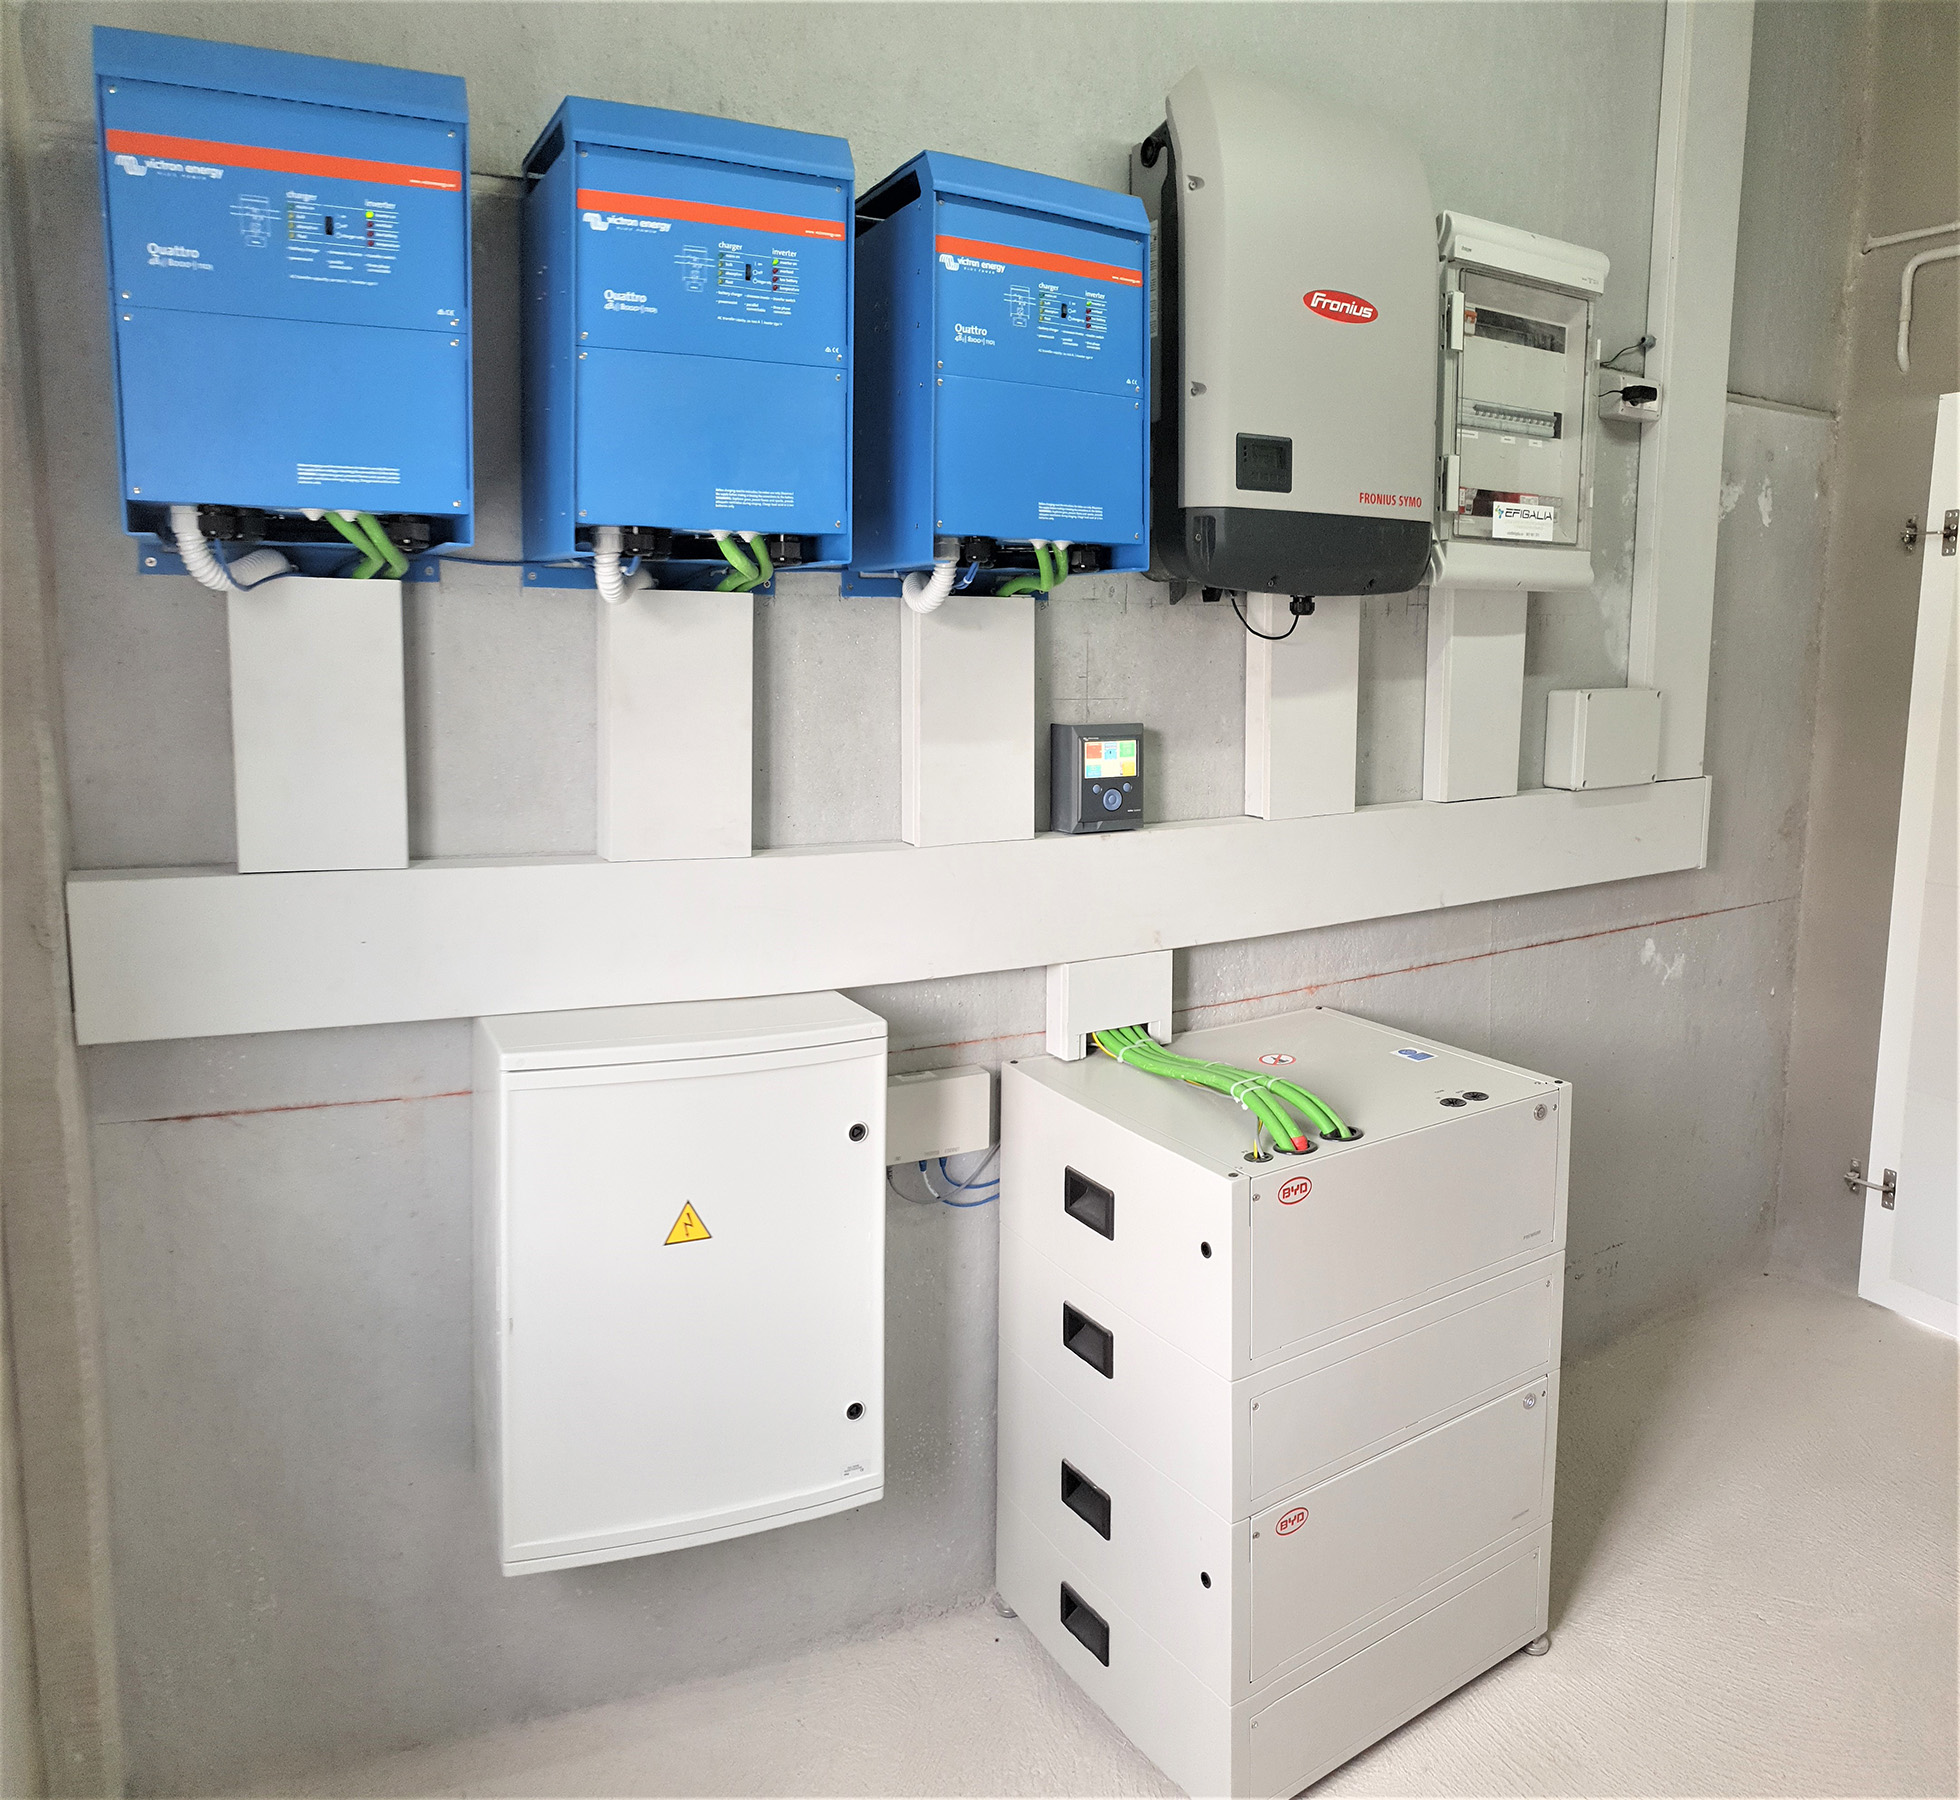
– Battery storage systems using BYD and Victron Energy technologies
– Hybrid and off-grid solar power systems
– Energy audits with Chauvin Arnoux diagnostic tools for optimal performance

Our projects are designed to provide reliable power, reduce carbon footprints, and lower long-term costs.

What Makes Nocheski Solar Different

Nocheski Solar stands out among solar power companies in Ghana because we blend European engineering standards with local knowledge. We don’t just install panels; we design smart energy systems.

Our Advantages:

– Certified partnerships with Victron Energy, Fronius, and BYD
– More than 20 years of technical experience in solar power installation
– Proven results from projects across all 16 regions of Ghana
– Clear pricing, professional maintenance, and support after installation

The Process: From Solar Consultation to Installation

Energy Assessment:
Our team conducts a detailed site audit to analyze consumption patterns and recommend the best solar capacity.

System Design:
Using advanced software tools, we model your solar power installation for maximum efficiency.

Professional Installation:
Our technicians manage every detail—mounting, wiring, and commissioning—to ensure your system performs at its peak.

Monitoring & Maintenance:
Every Nocheski Solar installation includes performance monitoring and routine checkups for long-term reliability.

The Future of Solar Energy in Ghana

In the next decade, Ghana’s solar market is set to grow significantly. With government incentives and a greater emphasis on energy independence, solar panel installations in Ghana will soon be as common as traditional power connections.

Nocheski Solar continues to lead this effort by offering world-class solutions for homes, institutions, and industrial clients looking to adopt clean energy and secure their operations for the future.

Conclusion

If you need a trusted solar installation company in Ghana, a partner for your commercial energy project, or an expert for residential solar panel installation, Nocheski Solar has the technology, experience, and dedication to meet your needs.

Join thousands of satisfied customers who have chosen Nocheski Solar and take your first step toward a brighter, greener Ghana.

Call to Action

Ready to go solar?
Visit www.nocheski.com or call us today on 0244270092 to schedule a free consultation.
Let’s power Ghana sustainably, one rooftop at a time.


In Ghana, access to reliable electricity is vital for quality healthcare, yet many rural communities still face severe power challenges. The Rotary Club of Accra-Spintex, working with Nocheski Solar, has changed that reality for the Alokpatsa Community-Based Health Planning and Services (CHPS) compound in the Oti Region. For years, mothers in Alokpatsa gave birth by candlelight or mobile phone flashlights due to the lack of electricity. But through the solar for life  project, this rural healthcare facility now has dependable power, transforming medical services and saving lives.

That changed in 2021, when Nocheski Solar, in partnership with the Rotary Club of Accra-Spintex (Ghana) and the Rotary Club of Rochester, Michigan (USA), installed a 5.2 kVA solar power system at the facility. This sustainable solar installation has transformed healthcare delivery in Alokpatsa, providing consistent electricity for safe childbirth, refrigeration of vaccines, and improved medical services.

Today, the Alokpatsa CHPS compound stands as a model for how renewable energy solutions by Nocheski Solar and Rotary partnerships are powering better healthcare and sustainable development across rural Ghana.


How Solar Energy Changed Healthcare in Alokpatsa

The solar project brought more than just light—it brought life-saving improvements:

  • Safe childbirth – Deliveries can now take place in well-lit rooms at any time of day.

  • Vaccine storage – Solar power ensures refrigerators stay on, keeping vaccines effective.

  • 24-hour patient care – Nurses and midwives can work without relying on candles or flashlights.

  • Community confidence – Families now trust their health facility to provide safe care.

This project proves that renewable energy is not just about sustainability—it is about saving lives.

https://www.youtube.com/watch?v=zJyyuJ1QgFI&t=603s


The Power of Rotary and Nocheski Solar

This project became a reality through strong collaboration:

  • Rotary International – Connected clubs worldwide to pool resources.

  • Rotary Club of Accra-Spintex – Identified the urgent healthcare need and championed the project.

  • Rotary Club of Rochester, Michigan – Contributed funding and global support.

  • Nocheski Solar – Brought technical expertise, professional installation, and high-quality solar equipment.

👉 Partnerships like this show how clean energy projects can transform healthcare in Africa.


Why Solar Power Matters for Healthcare in Ghana

Across Ghana, many rural clinics still face the same challenges Alokpatsa once did: no reliable electricity, unsafe nighttime deliveries, and limited access to vaccines.

Solar power changes that by providing:

  • Continuous electricity, even during grid failures.

  • Clean, sustainable energy with low maintenance.

  • Improved healthcare outcomes for women and children.

For Ghana and much of Africa, solar healthcare projects are the future of rural medicine.

In 2021, the Rotary Club of Accra-Spintex installed a new solar power system at the Alokpatsa Community-Based Health Planning and Services compound in eastern Ghana. For years, many babies had been born there by the light of candles and cellphone flashlights because of unreliable power.

In 2021, the Rotary Club of Accra-Spintex installed a new solar power system at the Alokpatsa Community-Based Health Planning and Services compound in eastern Ghana. For years, many babies had been born there by the light of candles and cellphone flashlights because of unreliable power.


Featured Globally

The Alokpatsa solar project has been recognized worldwide:


About Nocheski Solar

At Nocheski Solar, we provide renewable energy solutions that power homes, businesses, and communities across Ghana. With decades of experience in solar design, installation, and energy management, our mission is to deliver sustainable power that transforms lives.

The Alokpatsa CHPS solar project is just one example of how we combine technology and community partnerships to create long-lasting impact.


Key Takeaway

The light that now shines in Alokpatsa is more than electricity—it’s a symbol of safety, dignity, and progress. Thanks to solar energy, no mother in this community will ever have to give birth in darkness again.


Frequently Asked Questions (FAQs)

1. How does solar energy improve healthcare in rural Ghana?
Solar energy ensures safe deliveries, vaccine refrigeration, and uninterrupted patient care by providing reliable power to rural health facilities.

2. Who installed the Alokpatsa CHPS solar project?
It was delivered in 2021 by the Rotary Club of Accra-Spintex, Rotary Club of Rochester (Michigan, USA), and Nocheski Solar.

3. What role did Rotary and Nocheski Solar play in the project?
Rotary provided funding and global collaboration, while Nocheski Solar handled the design, supply, and installation of the solar system.


How much of the energy consumed in a typical building is accounted for by the lighting? If you don’t already know, you’ll probably be amazed that the answer is around 40%! As lighting is such a big contributor to the energy bill, it’s clearly an area that’s well worth looking at when it comes to making savings. But when considering economies, there are some important requirements and regulations to bear in mind, says Julian Grant of Chauvin Arnoux.

We all need light to work and, as an online search will quickly confirm, any number of studies have shown that good lighting increases worker productivity and wellbeing. So perhaps the 40% of your business’s energy bill that pays for lighting is money well spent? Maybe, but when such a large amount of expenditure is involved, it’s important to be sure. And, in reality, a little investigation will often reveal ways in which energy costs for lighting can be significantly reduced while maintaining or even improving the lighting environment.

Since lighting is so important for efficiency and safety, it might be expected that there would be statutory requirements for workplace lighting levels. In the UK at least, this is not the case, although it is important to bear in mind that the Workplace (Health, Safety and Welfare) Regulations require lighting to be “suitable and sufficient.” Rather more detailed and helpful guidance is, however, provided in the publication “Lighting at Work” (HSG38), which is available as free download from the Health and Safety Executive website (www.hse.gov.uk). This publication includes, for example, a table showing recommended minimum lighting levels for various work locations.

Further guidance on lighting is available from the Chartered Institution of Building Services Engineers (CIBSE) which publishes a code for lighting that is supplemented by a range of guides covering specific types of buildings such as offices, hospitals and sports facilities. These publications can be purchased from CIBSE.

After the appropriate light levels for a particular workplace have been determined, the next requirement is to check whether they are actually being achieved. This requires the use of a light meter (sometimes called a luxmeter). Simple types allow spot readings to be taken at any given location, but they are not ideal for checking the workplace environment for two reasons. The first is that lighting needs to be evaluated over an area, to ensure that light levels are adequate throughout the whole workplace and that there are no shadowed or dimly lit areas. The second reason is that lighting levels can vary throughout the working day or even from season to season, especially when natural light makes a major contribution. Lighting levels in particular areas may also fluctuate as people move around and cast shadows.

For these reasons, a logging light meter, such as the Chauvin Arnoux C.A 1110, is a much better option. This particular instrument has a mapping function, which allows the light levels throughout a room to be plotted automatically to confirm that the lighting is uniform and adequate. It can also collect and store results over time and can, therefore, be temporarily mounted in a particular location – it is magnetic, which makes mounting easy on any steel surface such as filing cabinet – when it will collect readings over hours, days or even weeks. These readings can then be downloaded to provide accurate and detailed information about changes in the lighting level throughout the monitoring period.

Obtaining accurate information about lighting levels is, of course, only the first step for those concerned with energy economy. The next step is to determine exactly how much energy the lighting system is using, and to identify areas where savings could be made. The key to achieving this is to use a portable energy logger (PEL). These versatile instruments can be easily installed at the distribution switchboard that supplies the lighting systems and will monitor energy usage over time. Some types can monitor multiple circuits simultaneously.

The results obtained from a PEL are often surprising and may even be horrifying! A frequent finding is that there is excessive out-of-hours energy usage – or, to put it another way, people forget to turn off the lights when they leave the building. Interestingly, a recent survey carried out by British Gas has shown that up to 46% of the energy used by SMEs was consumed outside normal business hours, so this is clearly an area worthy of careful consideration.

Fortunately, the solution is relatively simple: install a last-person-out switch so that the last person leaving the building can operate this single switch to turn off all of the lighting that’s not needed when the building is empty. Occupancy sensors can also be fitted to turn off the lights in individual rooms that are not being used. It shouldn’t be forgotten, however, that energy can be wasted on lighting even when the workplace is occupied and in use. It’s all too easy, especially in the winter months, to turn the lights on when natural light levels are low in the morning but neglect to turn them off later when natural light levels increase. The solution here is to install daylight sensors as part of the lighting controls.

In addition to effective control, another key factor in the energy efficiency of lighting is, of course, the type of light source. These days, in almost every case, the best choice will be LEDs. Not only are LED light sources much more energy efficient than other types,

they also have much longer lives and therefore greatly reduce maintenance costs, especially in large installations. When installing or converting to LED lighting, however, there are a few caveats.

In particular, the cheapest options may be far from the best choice. Cheap LEDs may have poor colour temperature, or colour temperature that is inconsistent as they age. They may be unreliable, and they will typically have shorter working lives than their apparently more expensive counterparts. It’s worth remembering that if an LED light source is half the price of a competitor but needs to be replaced once a year rather than once every five years, over the five year term it’s actually 2.5 times more expensive. And that doesn’t even take into account the cost of installing the replacements.

Also important to bear in mind is that not all types of LED light source are compatible with every type of control system, especially if dimming is required. For these reasons, it’s best to work with an expert LED lighting supplier who will provide dependable guidance and advice, particularly for large re-lamping projects.

When all the right control systems and all the best energy-efficient light sources are in place, there are two more essential tasks to be tackled. The first is to carry out another lighting survey with the light meter, to ensure that the planned lighting levels are being achieved. The second is to monitor the energy usage again with the PEL to ensure that the expected energy savings are being delivered.

These procedures will confirm the immediate effectiveness of the changes and upgrades that have been put in place, but they should not be considered as one-off events! Lighting surveys and energy monitoring should, in fact, be repeated periodically as part of routine maintenance procedures. This is because even the best of light sources lose output and shift in colour over time, and it’s by no means unknown for minor faults to develop on lighting systems – for example, are the daylight sensors still working? – which increase energy usage but could pass unnoticed without an energy survey.


As we’ve seen, there is the potential for many businesses to significantly reduce the amount of energy they use for lighting, with corresponding reductions in expenditure and environmental impact. The keys to unlocking these savings while providing lighting that will boost staff productivity and welfare are to install the right light sources, then regularly monitor their performance with a good logging light meter and a portable energy logger. These instruments are an excellent investment. They are modestly priced and they will pay for themselves in next to no time!


Lithium-ion and Lithium iron phosphate are two types of batteries used in today’s portable electronics. While they both share some similarities, there are major differences in high-energy density, long life cycles, and safety. Most people are familiar with lithium-ion as they most likely own a smartphone, tablet, or PC. Lithium iron phosphate (AKA LiFePO4 or LFP)  is a newer type of battery gaining recognition in the manufacturing industries due to its cost-effective materials and stability with high temperatures.

When using power sources to run embedded components, it’s not always simple to pop in a fresh set of batteries. Newer technologies, from smartphones to electric vehicles to portable power tools, require batteries that can hold a significant amount of energy, be lightweight enough to carry or move, and be safe for the user. Lithium batteries offer all these benefits for portable electronics, vehicles, medical equipment, and even grid energy storage.


Chemistries Of Lithium Iron Phosphate And Lithium-Ion

Charge and discharge rates of a battery are governed by C-rates. The capacity of a battery is commonly rated at 1C, meaning that a fully charged battery rated at 1Ah should provide 1A for one hour. The same battery discharging at 0.5C should provide 500mA for two hours, and at 2C it delivers 2A for 30 minutes.

Lithium-Ion

Lithium-ion can consist of two different chemistries for the cathode, lithium manganese oxide or lithium cobalt dioxide, as both have a graphite anode. It has a specific energy of 150/200 watt-hours per kilogram and a nominal voltage of 3.6V. Its charge rate is from 0.7C up to 1.0C as higher charges can significantly damage the battery. Lithium-ion has a discharge rate of 1C.

Lithium Iron Phosphate (LiFePO4)

Lithium iron phosphate has a cathode of iron phosphate and an anode of graphite. It has a specific energy of 90/120 watt-hours per kilogram and a nominal voltage of 3.20V or 3.30V. The charge rate of lithium iron phosphate is 1C and the discharge rate of 1-25C.

Example of a Lithium Iron Phosphate Battery Cell

Example of lithium iron phosphate battery cells.


What Are The Energy Level Differences?

There are significant differences in energy when comparing lithium-ion and lithium iron phosphate. Lithium-ion has a higher energy density at 150/200 Wh/kg versus LiFep04 at 90/120 Wh/kg. So, lithium-ion is normally the go-to source for power hungry electronics that drain batteries at a high rate.

On the other hand, the discharge rate for lithium iron phosphate outmatches lithium-ion. At 25C, lithium iron phosphate batteries have voltage discharges that are excellent when at higher temperatures. The discharge rate doesn’t significantly degrade the lithium iron phosphate battery as the capacity is reduced.

Life Cycle Differences

Lithium iron phosphate has a lifecycle of 1,000-10,000 cycles. These batteries can handle high temperatures with minimal degradation. They have a long life for applications that have embedded systems or need to run for long lengths of time before needing to be charged.

For lithium-ion, the higher energy density makes it more unstable, especially when dealing with higher operating temperature environments. It has a life cycle of 500-1,000 cycles as it can be negatively impacted based on the operating temperature of the electronics or working components.

Long-Term Storage Benefits

When it comes to storing unused batteries, it is important to pick a chemistry that doesn’t lose its charge over long periods of time. Instead, the battery should give close to the same charge performance as when it is used for over a year. Both lithium iron phosphate and lithium ion have good long-term storage benefits. Lithium iron phosphate can be stored longer as it has a 350-day shelf life. For lithium-ion, the shelf life is roughly around 300 days.

Safety Advantages Of Lithium Iron Phosphate

Manufacturers across industries turn to lithium iron phosphate for applications where safety is a factor. Lithium iron phosphate has excellent thermal and chemical stability. This battery stays cool in higher temperatures. It is also incombustible when it is mishandled during rapid charges and discharges or when there are short circuit issues. Lithium iron phosphate does not normally experience thermal runaway, as the phosphate cathode will not burn or explode during overcharging or overheating as the battery remains cool.

However, the chemistry of lithium-ion does not have the same safety advantages as lithium iron phosphate. Its high energy density has the disadvantage of causing the battery to be unstable. It heats up faster during charging as a lithium-ion battery can experience thermal runaway.

Another safety advantage of lithium iron phosphate involves the disposal of the battery after use or failure. A lithium-ion battery made with a lithium cobalt dioxide chemistry is considered a hazardous material as it can cause allergic reactions to the eyes and skin when exposed. It can also cause severe medical issues when swallowed. So, special disposal considerations must be made for lithium-ion. On the other hand, lithium iron phosphate is nontoxic and can be disposed of more easily by manufacturers.

Applications For Lithium Iron Phosphate And Lithium-Ion

Lithium iron phosphate is sought after for any electronics or machines where safety and longevity are desired but doesn’t need an extremely high energy density. Electric motors for vehicles, medical devices, and military applications where the technology will experience higher environmental temperatures. Lithium iron phosphate is also ideal for applications that are more stationary as the battery is slightly heavier as well as bulkier than lithium-ion, although it can be used in some portable technologies.

LiFePO4 may not be selected for applications where portability is a major factor due to its extra weight. For smartphones, laptops, and tablet devices, lithium-ion batteries are used. Any high-energy device that needs the best performance on the first day can benefit from the chemistry found on lithium ion batteries.

Besides looking for the right energy sources based on portability, safety and energy density, manufacturers also must consider the costs during the production of electronics as well as during disposal. Many manufacturers will select lithium iron phosphate as the cheaper battery alternative. The batteries cost less due to the safer iron phosphate chemistry as manufacturers don’t have to spend more money to recycle the materials.

Lithium Offering A Range Of Benefits

Advances in battery technologies has placed lithium chemistry at the head of the pack for being the best power source for high energy use devices that are portable. It’s long shelf life and the benefit in providing a continuous source of power over long periods of time is why both lithium-ion and LiFePO4 are reliable alternatives.

Currently, lithium batteries are still on the pricey side when compared to nickel metal hydride and nickel cadmium batteries. Yet, the long life of lithium batteries can equal out the initial high costs. For manufacturers trying to decide whether lithium-ion or  LiFePO4 will be ideal for applications, consider these key factors:

  • Highest energy density: lithium-ion
  • Good energy density and lifecycle: LFP
  • Stable chemical and thermal chemistry: LFP
  • No thermal runaway and safe when fully charged: LFP
  • Portability and lightweight characteristics: lithium-ion
  • Long life: lithium iron phosphate and lithium-ion
  • Low costs: LFP

Also, take the operating environment into serious consideration as well as any vibration issues that may be experienced. These instances may influence a manufacturer’s choices as the chemistry stability that lithium iron phosphate offers are superior than that of lithium-ion.


The Chauvin Arnoux Group in association with Nocheski puts all its know-how at the service of the prevention of the Covid 19 pandemic in Ghana

Measuring devices, metrology and low temperature sensors … the Chauvin Arnoux group offers a complementary offer to meet the health prevention challenges of today and tomorrow: Measure and analyze the quality of ambient air, identify potential carriers of ‘a Covid 19 Virus with infrared, control the temperature of vaccine storage freezers using low temperature probes.

WATCH VIDEO

Analyze the ambient air

The measurement of indoor air quality is essential to fight against the spread of Viruses, in particular that of COVID 19, in a building (schools, nurseries, offices, seminar rooms, workshops, public transport, hospitals, etc.) . At the heart of this prevention strategy, “measurement” and its analysis tools take on their full importance.

Fighting Covid 19 with ca 1510 Chauvin Arnoux

The CA 1510 portable air analyzer from CHAUVIN ARNOUX, very efficient in closed places, instantly records air particles according to standard thresholds and. It alerts by sound and “red screen” in the event of non-compliance with air quality criteria based on the CO2 level, temperature or humidity level or even the combination of the three physical quantities measured (CO2, temperature and relative humidity). Natural or artificial ventilation in confined spaces also plays a role in the spread of Covid 19 Viruses. In this respect, in addition, the CA 1227 thermo-anemometer has all the useful functions for measuring speed and air flow. Essential information to optimize the good ventilation of rooms.


Identify potential carriers of a Covid 19 Virus

In prevention, the measurement of potential indicators of disease such as fever are also provided by thermometers and thermal body cameras. The portable thermal camera CA 1900, easy to use, with immediate results and in complete safety through contactless distance, is one of the new sanitary devices to identify any person with too high a temperature and thus preventively fight against the risks of transmission of the disease.

Store vaccines

As part of the storage of the Covid 19 vaccine, the MANUMESURE company supports professionals in mapping their freezers at -80 ° C in COFRAC, intervening directly and quickly on site. PYROCONTROLE offers a range of low temperature (-80 °) temperature probes essential for players in the “Covid vaccine” sector; logistics (storage and transport), hospitals, pharmacists, doctors or even manufacturers of freezers …

Fighting Covid 19 with Chauvin ArnouxThe Chauvin Arnoux Group thus puts all its know-how, its adapted measuring devices and its metrology services at the service of pandemic prevention, to fully play its role in health situations such as the one we are experiencing today. For further inquiries on how to order these fine products in Ghana and the West Africa Region du contact Nocheski  on +233303211743 +233244270092 (Whatsapp) or email [email protected]


Ever heard of Solar Power as a Working-From-Home Perk? Installing solar power systems is already a tedious process for homeowners, and with many of us working and learning remotely, we’re too distracted to get started. Those renting or living in states where policies have made solar power a no-go can forget about it — lower bills due to solar are a pipe dream. But as many companies scramble to keep their employees motivated and rethink perks while their employees work from home, a Washington, D.C.-based startup says it has a solution.

Arcadia describes itself as the first nationwide “digital utility” in the U.S. Since its founding in 2014, the company’s platform is now available in all 50 states and with more than 100 power utilities. Users can acquire a solar power subscription from Arcadia, buy as little as one solar panel or more, and see the results as a credit on their monthly utility bills.

Therein lies an opportunity for a company’s virtual human resources desk to offer a new benefit to employees.

It’s true that we’ve seen a decrease in emissions worldwide due to the novel corona virus pandemic; how much of a reduction varies by the sources consulted. But here’s the problem for companies: For those that are tabulating their emissions as part of their sustainability or environmental responsibility strategies, many of those emissions have simply shifted from the properties they own or lease to their employees’ individual homes. Solar power can help solve that problem.

After all, many individuals’ utility bills have bumped upward, as we’re leaving our devices charged and air conditioning units running with greater frequency — not to mention the fact we’re using our household appliances more (yes, opening that fridge door constantly as a procrastination tactic adds more to your utility bill in the long term). But with working from home becoming the reality for many through 2021, companies now have the chance to offer employees financial relief while swatting away some of their own emissions.

In a recent interview with Fast Company, Arcadia CEO Kiran Bhatraju said the company’s corporate clients so far include McDonald’s, SkySpecs and CustomerFirst Renewables. But with more companies saying that working from home for the most part ended up becoming a net positive after the initial shell shock, watch for Arcadia to win more clients as remote work is redefining the very notion of “perks.”

In Ghana, where the Corona virus has increased working  from home options for many employees especially in the banking sector. Nocheski has therefore developed  special packages solar packages at very competitive prices. Call 0244270092 for more information


Low cost, large-scale Battery  storage is the key to accelerating the renewable energy revolution, and now shrimp have been enlisted in the cause. The aim is to push down the cost of flow batteries by using bio-based materials such as shrimp shells. That would help ramp up the transition   out of fossil fuels and into clean power, thus saving the planet in time to avert a climate catastrophe.

Scientists led by MIT have suggested chitin, a carbon and nitrogen-rich material made from waste shrimp shells, could produce sustainable electrodes for vanadium redox flow batteries and other energy storage technologies.

Expert projections indicate a potential annual revenue of $2 billion (€1.8 billion) from shrimp farming in Ghana, which in 2015 had excited the country’s President John Dramani Mahama, who foresees it overtaking incomes from oil and gas if successful.

Thank you, shrimp. Wait, what is a flow battery?


Shrimp (May) Be The Key to Energy Storage That Flows

We’ll get to that flow battery thing in a minute. First let’s clarify the news about shrimp shells and energy storage, which has been zooming all over the Intertubes in recent days.

The news involves research published in April at ACS Sustainable Chemical Engineering under the title, “Exploration of Biomass-Derived Activated Carbons for Use in Vanadium Redox Flow Batteries.”

The research team did not exactly determine that shrimp shells are the best bio-based material for flow batteries. What they did was compare shrimp shells to pine wood, in order to develop a method for determining the performance of a wide variety of bio-based materials and develop a general set of design principles.

Got all that? Good! Shrimp could still come out on top, but shrimp shells are just one of many bio-based sources that could be used to produce the activated carbon used in flow batteries.

The bio-based approach is relatively new, so before anybody skips to the front of the line, there needs to be “a systematic approach to advancing biomass-based functional materials for use in energy applications,” as the research team explains.

If you know your atoms, you know what the team means when they conclude that “electrochemically accessible surface area, rather than the heteroatom composition” is a more effective representative of the material’s performance.

Spoiler alert: surface area is a big deal in energy storage performance.

Why Shrimp Shells & Energy Storage Go Together Like Rice & Beans

The big question is why shrimp shells for energy storage, and the answer is chitin. Pronounced KY-tin, chitin is found in the exoskeletons, beaks, scales, and other hard parts of insects and aquatic creatures, as well as the cell walls of fungi, with shrimp and crab being the most common sources.

Chitin is already commonly used for edible film and other food products. It also pops up in biomedical and pharmaceutical applications.

As a large-scale byproduct of the food processing industry, chitin is cheap, abundant, and available practically all over the world. In other words, perfect for a world in search of low cost, sustainable energy storage.

Chitin has been a wallflower in the clean tech field, but it lately it has been emerging as a sustainable alternative to petrochemicals, and there have been hints that it could be used to make solar cells.

About That Flow Battery…

So, flow batteries. For those of you new to the topic, flow technology has been around for a while, but it has gained new significance in the age of decarbonization because it can provide for large scale, long duration energy storage at a relatively low cost.

Shrimp to Spark Flow Battery Storage RevolutionLithium-ion batteries are still the gold standard for energy storage, but they only last for a few hours. In order to integrate more wind and solar into the grid, you need energy storage technology that costs less and is more flexible and resilient, and is capable of handling grid-scale operations.

Flow batteries fit the bill. The basic idea is that two specialized liquids can generate an electrical current through a chemical reaction, when they flow adjacent to each other. Typically they are separated by a thin membrane, though researchers have experimented with formulations that do not require one.

Membrane or not, the two liquids can be stored indefinitely in their own tanks, of practically any size. Aside from providing for large-scale storage, the setup does not lose capacity over extended down time, as is the case with conventional batteries.

The US Department of Energy is all over flow batteries as a sustainable replacement for centralized, fossil fuel power plants. The technology is part of the agency’s broader push for large scale, long duration energy storage.

Energy Storage, Now With Vanadium (Not Vibranium)

As you may surmise, flow batteries involve two key challenges. One is how to ramp up the efficiency of the chemical reaction between the two liquids, while keeping costs down. That’s where the new chitin research comes in (for those of you keeping score at home, the research team includes scientists from both MIT and Tufts).

The other challenge is to formulate the optimal liquids for enhancing the reaction. The chitin research team settled on the all-vanadium redox flow battery formulation.

That’s vanadium, not vibranium. Both are metals, but only one actually exists outside of the Marvel Universe.

Our friends over at the Energy Department are quite interested in the all-vanadium formulation. Back in 2012, the agency discussed the pros and cons.

“There are many kinds of [Redox Flow Battery] chemistries, including iron/chromium, zinc/bromide, and vanadium,” the Energy Department explained. “Unlike other RFBs, vanadium redox flow batteries (VRBs) use only one element (vanadium) in both tanks, exploiting vanadium’s ability to exist in several states.”

The one-element solution enables VRBs to avoid cross-contamination issues, which is a significant problem for other chemistries.

That doesn’t mean it’s all smooth sailing for VRBs, though.

“Sulfuric acid solutions, the electrolyte used in current VRBs, can only hold a certain number of vanadium ions before they become oversaturated, and they only allow the battery to work effectively in a small temperature window,” said the Energy Department.

“The low energy densities and small operating temperature window, along with high capital cost, make it difficult for the current VRBs to meet the performance and economic requirements for broad market penetration,” the Energy Department summed it up.

That didn’t stop New York City from dabbling in the technology back in 2014, in a project featuring vanadium technology developed by the company CellCube.

Meanwhile, the Pacific Northwest National Laboratory has been among those on the prowl for improvements to the technology, and the lab has come up with new energy storage chemistries that help keep costs down while addressing the energy density and temperature issues.

Last year the Energy Department surveyed emerging grid-scale energy storage options and noted that redox flow batteries “appear to be well positioned” due to the rapid pace of improvement in the technology.

As one indicator of stepped-up activity in the vanadium flow battery field, earlier this year the US company Avalon  joined with redT Energy of the UK to form Invinity Energy Systems, which bills itself as “the world’s leading vanadium flow battery company.”