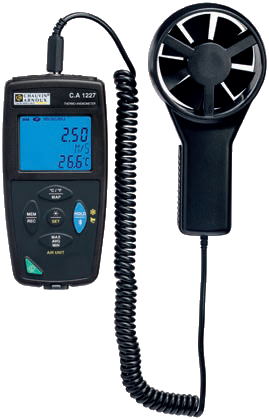
 – C.A 1227 Thermo-anemometer
These aspects of the environment are, however, easy to measure and monitor. Inexpensive, easy-to-use equipment is now available that will accurately measure airflow, CO2 levels, temperature and humidity in the working environment and, with some types, log the results over time so that variations throughout the day and even throughout the year can be seen. These results provide useful insights that not only help with achieving energy savings, but also make it easier to demonstrate that working environments meet the requirements of standards and guidance such as the Workplace (Health, Safety and Welfare) Regulations 1992, HSE Thermal Comfort guidance and EH40/2005 Workplace Exposure Limits.
Though not as obviously related to the workplace environment as, for instance, lighting, electric motors play an important role in almost every business and are big consumers of energy. In fact, according to the Carbon Trust, motors consume about two-thirds of the energy used by UK industry, and the running cost of a motor for a year can be as much as ten times what it cost to buy it in the first place. Clearly, energy e iciency in relation to motors is an important topic. And, should you be thinking that motors don’t play a significant role in your particular business, remember all those motor driven fans and pumps in your building’s climate-control systems.
Because of the importance of motor e iciency, this is now covered by an international standard, the latest version of which is IEC 60034-30-1. This divides motors into five e iciency classes, IE1 to IE5, with IE5 motors being the most efficient. If you’re in a position to specify new motors, it is always worth choosing the higher efficiency types. These now cost little if any more than ‘ordinary’ motors, yet they can typically reduce running costs by between 3 and 5%.
Another thing to consider in relation to motors is whether they should be fitted with variable speed drives (VSDs). In many older climate control systems fan motors have simple on-o control, so they are either running at full speed or they are stopped. When they’re running at full speed, unless the weather is particularly hot, the fans produce too much air flow, so this has to be controlled by throttling and the use of dampers. Unfortunately, these devices do nothing to reduce the amount of energy consumed by the motor.
A much better approach is to fit a VSD so that the speed of the motor can be adjusted to provide the exact level of airflow needed at a particular time. The situation with pumps is very similar and, in both cases, it is quite usual to find that the motor operates at 80% of full speed or less almost all of the time. Since a fan or pump motor running at 80% speed consumes only half the energy it would when running at full speed, it’s easy to see that very big energy savings are possible, and that the cost of buying and fitting the VSD will be recovered very quickly
Having briefly dealt with energy-saving opportunities that relate to the workplace environment, let us now move on to the second group of opportunities that was mentioned in the beginning of this section: that is, opportunities that relate to technical aspects of the electricity supply. The most important of these, by a very wide margin, is power factor, which is dealt with much more fully in a later section.
A short explanation, however, is that the energy consumed by electric motors (and many other types of electrical device) is made up of two components: the useful component that turns the motor and the useless component (or to use a rather more formal term, the wattless component) that does absolutely nothing worthwhile. The catch is that you, as a non-domestic consumer, pay just as much for the useless power as you do for the useful power.
Fortunately, it’s easy to measure the amount of wattless power that an electrical system is consuming, and to install equipment that will greatly reduce this without a ecting the performance of the system in any way. This is known as power factor correction. It’s inexpensive, reliable and, in very many cases, it will deliver big savings and when it’s in place, you will no longer be throwing money away in return for “useless power”.
A second technical aspect of the power supply that’s worthy of attention is phase voltage imbalance. The voltage on all three phases should ideally be the same. In the real world, small deviations are inevitable but they should be very small because, for given percentage voltage imbalance, the resulting increase in current can be ten times greater. In other words, a 2% voltage imbalance can produce a 20% increase in the current in the phase a ected. This is bad news not only in terms of energy consumption, but also because the higher current will generate more heat in the motor, leading to an increased risk of failure.
Finally, it’s important to look at harmonics in the power supply. These are currents at frequencies that are integer multiples of the power supply frequency so, for a 50 Hz system, the harmonic currents will be at 100 Hz, 150 Hz, 200 Hz, 250 Hz and so on. The e ect of harmonics is, once again, to produce additional heating in the load, and they also figure in the amount of energy for which you are billed
As with power factor, phase imbalance and harmonics can readily be measured and recorded. Remedial action is not quite as straightforward as it is with power factor. It will be necessary to trace the source of the problem and, in most cases, corrective measures will have to be put in place at the source. The e ort will, however, be well worthwhile.
This section has looked at areas where most, if not all businesses, can make worthwhile energy savings. Most of these are summarised in the table below, which is based on data from a number of reliable sources including the Carbon Trust and British Gas.
|
Potential |
|
Saving |
|
|
| E ective energy e iciency measures |
20% |
|
|
| Average SME out-of-hours usage |
46% |
|
|
| Occupancy sensor controlled lighting |
30% |
|
|
| Automatic daylight adjustment for lighting |
40% |
|
|
| LED lighting in place of incandescent |
80% |
|
|
| Power factor correction |
30% |
|
|
To control, you must measure
A clear message from the previous section is that energy control is the key to energy e iciency. But it’s an almost universally accepted fact that, if you want to control something, you first must be able to measure it. That’s certainly true when it comes to energy. To make savings, you first need to understand your energy usage and that’s not something you can do by relying on intuition or guesswork. How many businesses, for example, would estimate that lighting accounts for 40% of their energy costs? Yet that is, as already mentioned, the typical figure.
And there’s also another aspect to energy measurement. Suppose you decide on some energy saving measures and implement them. How do you know how well they’ve worked? Sure, your energy bills may have gone down, but have you reduced energy usage by as much as you expected? Or by as much as you could have? If the bills start to climb again, what’s gone wrong? Measurement is the only way to provide dependable answers to these questions. Ideally, the procedure should be to measure and analyse energy consumption, implement energy saving measures, then measure and analyse the consumption again. The before-and-after figures will reveal the success of the measures, and subsequent ongoing measurements will confirm the continuing e ectiveness of the measures.
These ideas are, in fact, reflected in national and international standards and protocols. The ISO 50001 standard, for example, requires organisations to “establish, implement, maintain and improve an energy management system, whose purpose is to enable [the] organisation to follow a systematic approach in achieving continual improvement of energy performance, including energy e iciency, energy security, energy use and consumption.” Similarly, the
International Performance Measurement and Verification Protocol (IPMVP) is “a framework document describing shared best practices for measuring, calculating and monitoring the savings achieved in the context of energy e iciency projects.”
The requirements of ISO 50001 clearly imply a need for measurement, for how else can “continual improvement” be assessed, and the IPMVP explicitly mentions “best practices for measuring … and monitoring”. But what is the best way to monitor, in detail and over time, the energy consumption of electrical installations? Many modern distribution and energy management systems actually
incorporate energy monitoring and logging facilities, but it’s important to check on their capabilities before relying on these. Often, they have only a limited amount of memory, which means they’re unable to store results over extended periods of time, and many integrated monitors store only summary data that doesn’t provide the level of detail needed for truly e ective energy optimisation.
Fortunately, the latest generation of portable power and energy loggers (PELs) provides a convenient, cost-effective and altogether more capable alternative. Modern PELs are compact, lightweight electronic monitoring instruments that have been developed specifically to make it easy to collect electrical data. They can be temporarily placed in distribution panels, or even around the premises, without difficulty and without the need to interrupt the mains supply or turn equipment off . The flexible current coils are simply looped around the phase conductors,while the magnetic voltage probes stick to the screw
heads on the MCBs – although they can, of course, also be wired in if additional security of connection is needed.
– Chauvin Arnoux PEL 103

The PEL 113 measures and records all the power and energy values.
It can be used wherever there is electricity:
• electricity generator: renewable energies, thermal energy, etc.
PELs gather data and calculate key electrical parameters such as three-phase current power and energy, along with phase angle, power factor, and harmonic levels
The best instruments of this type can store millions of readings, collected automatically over time, and this data can be retrieved locally or remotely via a USB or Ethernet connection, or a wireless Bluetooth link. In large premises or where a business operates from multiple premises, it’s often convenient to install PELs in several di erent places. Data from all of them can be retrieved to a single location, without the need to visit each PEL to interrogate it. PELs can also be moved round an installation to provide convenient local monitoring of departments or even individual items of equipment.
PELs are often used for short-term measuring and monitoring, but they can also be installed permanently. Better models feature slim designs and a magnetic back, so they are easily accommodated even where space is limited, and they need no installation other than simply sticking them to the steel door or wall of a distribution cabinet. Unlike older instruments, they don’t need equipment to be turned o and isolated so that doors can be drilled and cut-outs made. These are very important benefits as the di iculty and cost of fitting traditional instruments has often deterred businesses from installing the monitoring equipment that will unlock large energy savings.
– Chauvin Arnoux PEL 103
Once your business has invested in a PEL, or indeed several PELs, the next step is to carry out an energy audit, to establish a baseline against which improvements can be judged. With a PEL, this is a simple process. The PEL is set up to monitor key circuits – some PELs can simultaneously monitor multiple circuits – and is left in place to collect data over a representative time period.
The actual period will depend on the application. For a continually running process line, one day might be enough, but more typically a week or even a month will be more appropriate.
The data is then downloaded from the PEL and can be readily visualised and analysed using software supplied by the PEL manufacturer. Audit reports can also be produced for future reference so that the e ects of energy economy measures can be readily evaluated. The data from the PEL will show immediately where the most energy is being used and, therefore, where there is likely to be the most potential for making improvements. Based on this information from the audit, an informed decision can be made about the type of improvements to implement and where to implement them.
– Current over time graph on DataView®
The audit will also provide the information needed to formulate a metering plan, which is simply a plan to measure energy usage over extended time periods. This is essential not only to gauge whether energy e iciency measures are e ective in the short term, but also whether they remain e ective in the long term – they might be nullified, for example, by faulty equipment – and whether there is room for further improvement, in line with the aspirations identified in both ISO 50001 and IPMVP for “continual improvement”.
Rules, guidelines and requirements
Cost may be the driving force for reducing energy usage in many businesses but there’s another reason that’s arguably even more important: climate change. It’s almost universally accepted that, if we don’t take drastic steps to cut our carbon emissions – starting now – the consequences for the future of our planet are likely to be dire and the damage we are doing irreparable.
6
Climate change in itself should be a su iciently compelling reason to reduce energy usage, but there’s also another factor: if we don’t reduce energy consumption, it’s perfectly possible that, in the not-so-distant future, there will not be enough generating capacity to meet our needs. National Grid has recently warned that by 2030, electric cars could require between 3.5 and 8 GW of additional generating capacity on top of the current peak demand of 60 GW. And to put that in perspective, the new Hinkley Point C nuclear power station currently under construction will add just 3.2 GW of capacity.
Every business today must, therefore, be conscious of its energy usage and its carbon footprint and work continually toward reducing them. As we shall see shortly, this is backed up by legislative requirements, but it’s worth bearing in mind that there’s another factor: tenders for many lucrative contracts now require those tendering to explain their environmental policies and demonstrate their e ectiveness. Failure to do so means disqualification from the tender process and inevitably loss of business.
In other words, if you’re a business owner or manager, you simply cannot a ord to neglect the environmental impact of your operations – and there’s plenty of legislation to make sure that you don’t.
Most of this has its roots in the Kyoto Protocol, which was adopted by 192 countries of the world, including the UK, in December 1997 and came into force in February 2005. The objective of the Protocol, in simple terms, is to reduce greenhouse gas emissions to a level where they will no longer alter weather patterns
Based on its commitment to the Kyoto Protocol, the UK government introduced the Climate Change Act 2008, which committed the UK to reducing greenhouse gas emissions by 80%, compared with the 1990 baseline, by 2050. An interim target of a 34% cut by 2020 was subsequently made legally binding in April 2009 budget statement and, in 2019, a new target of ending the UK’s contribution to global warming completely by 2050 became law.
To ensure that businesses play their part in achieving
these challenging targets, the government included
the CRC Energy E iciency Scheme as part of the Climate
Change Act. On 1st April 2019, however, this was superseded
by the Streamlined Energy and Carbon Reporting (SECR)
policy, as implemented by the Companies (Directors’
Report) and Limited Liability Partnerships (Energy
and Carbon Report) Regulations 2018. According to the
Carbon Trust website, “the new regulations will require
an estimated 11,900 companies incorporated in the UK
to disclose their energy and carbon emissions – a far greater number than were required to act under the CRC.”
The regulations apply to companies with at least 250 employees or an annual turnover greater than £36m, as well as an annual balance sheet greater than £18m. Companies reporting into the SECR will also include those in the Energy Saving Opportunities Scheme (ESOS). If a business meets the criteria it will be automatically entered into the scheme and details of its energy use and carbon emissions, as well as its actions to improve energy e iciency, will be made publicly available, alongside reference metrics.
For businesses that haven’t already thought about increasing energy e iciency, compliance with SECR will involve additional costs for administration and possibly for equipment purchase. However, if e ective energy e iciency measures are implemented, this outlay will be rapidly recovered. To achieve this, companies should embrace an energy management system that includes people, processes, and technology, and go back to the basics of energy management by analysing their operations to understand the meaningful and sustainable changes that can be made.
Supporting businesses in their endeavours to improve energy e iciency, whether or not they are covered by the SECR, is the international ISO 50001 standard which, as mentioned in an earlier section of this white paper, aims to help organisations continually reduce their energy use, and the International Performance Measurement and Verifica-tion Protocol (IPMVP), which was also mentioned earlier.It is worth looking at the IPMVP in some detail, because it is part of a very practical approach for controlling, optimising and reducing energy costs by measuring technical and economic performance. It explains how to define a standardised procedure for auditing, measurement and verification of energy performance, and is now the most widely used framework for this purpose.
At the heart of the IPMVP framework there is a written ‘Measurement and Verification Plan’ which is formulated to ensure repeatable measurement campaigns so that the results of subsequent analyses are comparable and reliable. This preparation of the plan is an essential foundation for any energy e iciency project and involves drafting a complete procedure and documenting all the points where measurements will be made.
In energy e iciency projects, an exhaustive approach is essential. All the parameters that may have a significant influence on energy savings have to be measured, and the measurements must be considered in the context of the site as a whole. This will allow energy budgets to be managed precisely and will underpin the validity of the actions specified in the measurement and verification plan.
The definition of the content of the reports and the precision of the performance measurement methodology are crucial features for establishing the credibility of the Measurement and Verification Plan and for ensuring that it is accepted by all stakeholders. The accuracy of the measurements, the equipment used for monitoring and the test procedures all contribute to assessing the improvements made and, ultimately, the return on investment. A detailed and well-structured Measurement and Verification Plan will therefore encourage investors to finance energy saving projects.
The IPMVP methodology divides implementation into four phases:
Phase 1: Define requirements and make measurements
It is essential to start by producing a historical, comparative analysis of consumption. The first step is to analyse the bills from electricity suppliers, but these will only provide information about the total consumption of the site. It is therefore necessary to subdivide the consumption and allocate it across the various users of electricity on the site – for example, factory, workshop, production line, o ice areas, etc. Doing this involves real-time monitoring and logging of consumption for each user, followed by the creation of reports, charts and summaries.
Phase 2: Plan and implement solutions
On the basis of the measurements and analyses performed in Phase 1, an investment plan is developed which gives details of the energy-saving measures to be adopted and their expected outcomes. Once the investment is approved, the plan is implemented. Examples of the measures that frequently form part of such plans are switching to LED lighting, changing electric motor control systems to allow variable speed opera-tion, replacing old motors with modern high-e iciency types and taking steps to ensure that lighting and equipment is always turned o when it is not needed. Note that energy saving measures may also be needed for non-electrical systems, such as those that consume gas and compressed air. It is also worth remembering that eliminating waste is an important way to achieve energy savings, but it should always be accompanied by best possible energy e iciency in every situation.
8
Phase 3: Measure and verify improvements
A measurement campaign is carried out to ensure that the expected savings are actually being achieved. Measurements should be made that allow the results of each energy saving measure to be compared directly with the initial objectives. Any measure that falls short of these objectives should be reassessed and, if necessary, modified.
Phase 4: Ongoing periodic testing
Improving energy e iciency isn’t a once-and-for-all-time action! Equipment can fail or degrade, and over time, operating conditions can change. To allow for this, a procedure must be set up for testing periodically – typically every six or twelve months. The tests must be exhaustive and should look at all of the elements of the on-site installations. In the case of the electrical systems, these will often include the lighting network, the general single-phase distribution network and the three-phase distribution network as well as, in many cases, standby generators and uninterruptible power supplies (UPSs).
In summary, all of the standards and regulations mentioned in this section recognise, either implicitly or explicitly, that accurate and detailed measurements are an essential requirement for optimising energy e iciency, supervising electrical networks and allocating costs fairly. Regular measurement of performance is the only way to guarantee long-term energy e iciency.
Power factor: paying for electricity you don’t use
Power factor was briefly mentioned earlier in the context of reducing energy costs and now it’s time to consider this important topic in more detail. The headline news, however, is simple and shocking: if your electrical systems have a poor power factor, you are regularly paying out large sums of money for electricity you don’t – and can’t – use!
This is not a new issue; for decades, experienced engineers looking after industrial and commercial sites have put measures in place to ensure that their sites had a good power factor. But today, fewer and fewer sites have such engineers to take care of them and, as a result, power factor gets forgotten and the inevitable result is needlessly inflated energy bills. But what actually is power factor, and why is it so important?
The key to the explanation is that some types of electrical equipment used in industrial and commercial applications consume a certain amount of reactive power in addition to the real (or active) power they need to do the job for which they are intended. These are often inductive devices – that is, devices that incorporate coils of wire as part of their construction. Examples are motors, induction heaters, arc welders, compressors and most types of fluorescent lighting. It’s important to understand that the reactive power doesn’t, as far as the user of the equipment is concerned, do anything useful.
Technically speaking, reactive power is the vector di erence between the real or active power used by a device, and the total power it consumes, which is known as the apparent power. And power factor is the ratio of the real power to the apparent power. A device with a low power factor – which is more often called a poor power factor – draws more current than a device that’s doing an equal amount of useful work but has a high (or good) power factor. Higher currents increase energy losses in the electricity distribution system, so energy suppliers penalise customers that have a poor power factor by charging them more for their electricity.
Reactive power is measured in kVAr (kilovolt-amperes reactive), active or real power is measured in kW (kilowatts) and apparent power is measured in kVA (kilovolt-amperes).
Speaking less technically, this scenario can be made rather easier to understand by thinking about beer! If you order a pint of draught beer, the whole glass you pay for is equivalent to the apparent power. But take a closer look – that beer has got a frothy head on it! The beer is the part you really want, and that’s equivalent to the active power, while the head, which makes no
contribution to your refreshment, is equivalent to reactive power. A pint glass full of beer, with no head, would represent a power factor of 1 with no reactive power at all. In reality, that’s usually impossible to achieve and a power factor of 0.95 (corresponding to less than 5% froth!) or better is usually considered acceptable.
So far, so good, but if electrical equipment inherently consumes active power, what can be done about it? Fortunately, it is possible to correct for power factor by adding, logically enough, a power factor correction (PFC) system. This usually takes the form of capacitors connected at the main distribution board, or sometimes at other locations.
Many sites will already have some form of PFC but, as implied earlier, it is not quite a fit-and-forget solution. If more equipment is installed on a site, or the type of equipment used on the site is significantly changed, the PFC system may no longer be adequate. It’s also worth noting that capacitors used for PFC can degrade over many years of service and may eventually need to be replaced.
In fact, according to The Carbon Trust it is not uncommon for industrial installations to be operating with high levels of reactive power giving power factors of between 0.7 and 0.8. This is surprising and totally unnecessary since measuring power factor is not at all di icult. It can be readily measured using portable test instruments, or alternatively, can be permanently monitored in real-time with constantly displayed values, along with a multitude of other useful parameters including voltage, current and energy consumption.
While specification of a PFC system to reduce reactive power requires knowledge of several factors including the voltage level and typical usage of the reactive loads on-site, the usage profile across the site, and the power quality required by the on-site loads, all of these are easily measured and/or calculated. And a properly designed PFC system will be a fraction of the cost of the savings it delivers.
The simplest form of PFC involves fitting capacitors, but it is worth shopping around and taking expert advice to find a system that will accurately suit your particular requirements. If a single machine has a poor power factor, capacitors can be connected in parallel with it, so that they compensate for the poor power factor whenever the machine is switched on. Alternatively, if the power factor of a site is permanently poor and no single item of equipment is solely responsible, fixed PFC can be connected across the main power supply to the premises.
In more complex applications, where many machines are switched on and o at various times, the power factor may be subject to frequent change. In this case the amount of PFC needs to be controlled automatically by switching banks of capacitors into and out of circuit, as required. And in facilities with large non-linear loads, with their associated harmonic currents, it may be necessary to use a de-tuned PFC system. Numerous solutions are available on the market to provide such functionality, but expert advice should always be sought if you are in any doubt.
A Power Factor Correction Case Study
In June 2016, a request was received from a metal fabrication business to monitor its electricity usage. Monitoring was carried out over a period of four days, and the results are shown in the blue column of the table below. It can be seen that the average power factor, measured over those four days, was 0.73. To put that into perspective, a power factor of 0.7 requires approximately 43% more current to do the same thing as an installation with unity power factor.
After the installation of appropriate automatic power factor correction equipment in January 2017, the average power factor the monitoring exercise was repeated, this time for a whole week. The results are shown in the green column of the table, and this time the power factor averaged 0.98. The apparent power was reduced by just over 13%. Current dropped by between 10% and 17% per phase, and reactive power was reduced from 119 kVAr to less than 8 kVAr. These reductions were achieved even though there was a slight increase in demand during the 6 months between the two sets of measurements.
| Monitoring 29/6/2016 – 1/7/2016 |
Measured |
Monitoring 3/1/2017 – 10/1/2017 |
Measured |
|
|
|
|
| Voltage (V) |
414.00 |
Voltage (V) |
417.90 |
| Power Factor |
0.73 |
Power Factor |
0.98 |
| L1 (A) |
313.10 |
L1 (A) |
284.60 |
| L2 (A) |
312.90 |
L2 (A) |
260.80 |
| L3 (A) |
287.50 |
L3 (A) |
248.70 |
| Power (Kw) |
171.50 |
Power (Kw) |
182.48 |
| Apparent Power (KVA) |
210.20 |
Apparent Power (KVA) |
184.41 |
| Reactive Power (KVAr) |
119.30 |
Reactive Power (KVAr) |
7.54 |
|
|
|
|
Based on a real-to-apparent power di erence prior to the power factor correction of 38.7 and a real-to-apparent power di erence after the power factor correction of 2, and assuming an electricity cost of £0.15 per kWh, this equates to a saving of over £8800 per year in electricity costs.
Credit for this case study goes to Power Quality Improvement Services (PQIS
Action this day!
If this white paper has made it clear that finding a cheaper energy supplier is not the only – nor necessarily the best – way of cutting your energy bill (and, by the way, protecting our precious planet), then it has achieved its purpose. Or at least it will have if you act on the ideas and suggestions above. It’s all too easy to put a document like this to one side with the full and genuine intention of acting on its recommendations at some future date. The danger is that the future date may never arrive! So why not start to plan your new energy strategy right now? Here are some of the actions you may want to consider including:
Buy some kit for measuring and monitoring
To identify the best opportunities for saving energy, you’re going to need measuring equipment, most likely in the form of portable energy loggers (PELs). You can hire these, but you’re likely to find that buying them outright is a better option because you’ll want to monitor your installations for extended periods as an aid to planning your actions and, of course, when you’ve put your energy saving measures in place, you’ll want to carry on measuring and monitoring to confirm their e ectiveness.
Start measuring and monitoring to establish a baseline
Decide on a date to start your measuring campaign and stick to it! Make sure that you choose the start date and the period your campaign covers so that you record typical data for your installations. Measuring energy consumption over the Christmas break, for example, probably won’t give you the information you need. And don’t be in too much of a hurry – within reason, the longer the period over which you collect data, the more useful will be the results.
Analyse your data and decide on the next steps
The data from your measurement campaign will almost certainly reveal areas of your business that are ripe for energy savings. Simple but very common examples include changing to LED lighting and ensuring that lighting and heating is turned o , or at least turned down, when it’s not needed. Use your measurement data to plan your changes, and don’t forget to quantify the results you expect each change to deliver.
Make the changes!
Remember to ensure that you’ve got all the materials and labour resources you need lined up for the date you plan to make the changes. Then go ahead and make them.
Keep on measuring and monitoring
Measuring and monitoring after you’ve made your changes is just as important as it was before you made the changes, because you need to know how e ective your actions have been. As always, measuring and monitoring should cover typical operating periods for your business.
Evaluate your results
Carefully compare your before and after measurements. Did each of your energy saving actions deliver the results expected of it? Should some of your actions be fine-tuned, extensively modified or even abandoned? Do the new results suggest further energy saving actions that might be useful? Could actions similar to those that have been successfully applied in one part of your business be equally successful in other parts?
Keep on measuring and monitoring
Optimising energy e iciency is not something you do once and then forget! It’s a way of life, an ongoing process that has continuing measurement at its core. After all, even if your initial energy saving e orts are every bit as e ective as you hoped, there’s no guarantee that they’ll remain e ective indefinitely; even the best equipment can break down and it its performance will almost certainly deteriorate as it ages. On-going monitoring will help you to spot these issues and deal with them promptly. And, who knows, it may also help to identify even more ways of saving energy and money.
A final note
We at Chauvin Arnoux hope you have found this white paper to be informative and useful. We also hope that it will help you to save money and to reduce the environmental impact of your business operations. We’ve tried to present the information as clearly as possible but there’s no doubt that energy e iciency is a complex subject.
So, if you’d like further information about the ideas we’ve put forward, or if you’d like help with starting your own energy-e iciency campaign, please get in touch with us. Talking to Chauvin Arnoux won’t cost you a penny, but it could save you a fortune – and help to save our planet.